Exam 1: Exploring and Understanding Data
Exam 1: Exploring and Understanding Data125 Questions
Exam 2: Exploring Relationships Between Variables165 Questions
Exam 3: Gathering Data111 Questions
Exam 4: Randomness and Probability148 Questions
Exam 5: From the Data at Hand to the World at Large128 Questions
Exam 6: Accessing Associations Between Variables93 Questions
Exam 7: Inference When Variables Are Related25 Questions
Exam 8: Regression, Associations, and Predictive Modeling792 Questions
Select questions type
A survey conducted in a college intro stats class asked students about the number of credit hours they were taking that quarter. The number of credit hours for a random sample of 16 students is given in the table. 10 10 12 14 15 15 15 15 17 17 19 20 20 20 20 22
-a. Sketch a histogram of these data
b. Find the mean and standard deviation for the number of credit hours.
c. Find the median and IQR for the number of credit hours.
d. Is it more appropriate to use the mean and standard deviation or the median and IQR to
summarize theses data? Explain.
(Essay)
4.8/5  (47)
(47)
Suppose that a Normal model describes the acidity (pH) of rainwater, and that water tested after
Last week's storm had a z-score of 1.8. This means that the acidity of that rain …
(Multiple Choice)
4.9/5 (36)
The Wechsler Adult Intelligence Scale - Revised (WAIS-R) follows a Normal model with
mean 100 and standard deviation 15. Draw and clearly label this model. 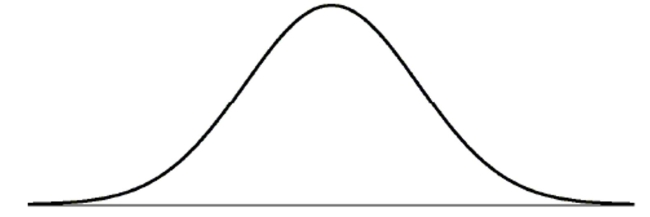
(Essay)
4.9/5 (36)
Suppose that a Normal model described student scores in a history class. Parker has a standardized
Score (z-score) of +2.5. This means that Parker
(Multiple Choice)
4.9/5 (36)
The side-by-side boxplots show the cumulative college GPAs for sophomores, juniors, and
seniors taking an intro stats course in Autumn 2003. 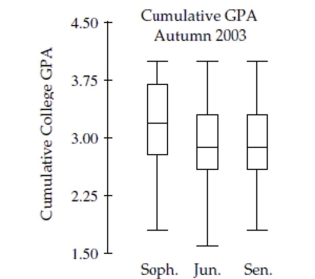 a. Which class (sophomore, junior, or senior) had the lowest cumulative college GPA?
What is the approximate value of that GPA?
b. Which class has the highest median GPA, and what is that GPA?
c. Which class has the largest range for GPA, and what is it?
d. Which class has the most symmetric set of GPAs? The most skewed set of GPAs?
a. Which class (sophomore, junior, or senior) had the lowest cumulative college GPA?
What is the approximate value of that GPA?
b. Which class has the highest median GPA, and what is that GPA?
c. Which class has the largest range for GPA, and what is it?
d. Which class has the most symmetric set of GPAs? The most skewed set of GPAs?
(Essay)
4.9/5 (37)
The boxplots show prices of used cars (in thousands of dollars) advertised for sale at three different car dealers.  a. Which dealer offers the cheapest car offered, and at what price?
b. Which dealer has the lowest median price, and how much is it?
c. Which dealer has the smallest price range, and what is it?
d. Which dealer's prices have the smallest IQR, and what is it?
e. Which dealer generally sells cars cheapest? Explain.
a. Which dealer offers the cheapest car offered, and at what price?
b. Which dealer has the lowest median price, and how much is it?
c. Which dealer has the smallest price range, and what is it?
d. Which dealer's prices have the smallest IQR, and what is it?
e. Which dealer generally sells cars cheapest? Explain.
(Essay)
5.0/5 (39)
The five-number summary for midterm scores (number of points; the maximum possible
score was 50 points) from an intro stats class is: Min 1 Median Q3 Max 16.5 32 39 43.5 48.5
a. Would you expect the mean midterm score of all students who took the midterm to be
higher or lower than the median? Explain.
b. Based on the five-number summary, are any of the midterm scores outliers? Explain.
(Essay)
4.8/5 (32)
The SPCA has kept these data records for the past 20 years. If they want to show the trend in the
Number of dogs they have housed, what kind of plot should they make?
(Multiple Choice)
4.8/5 (36)
To see if your school's ACT scores are improving since implementing a new program, the ACT
Scores for the past several years should be displayed in a
(Multiple Choice)
4.7/5 (39)
The advantage of making a stem-and-leaf display instead of a dotplot is that a stem-and-leaf
Display
(Multiple Choice)
4.9/5 (33)
Cellphones ConsumerReports.org evaluated the price and performance of 99 models of cellphones. Computer output gives these summaries for the prices: Min Q1 Median Q3 Max MidRange Mean TrMean SD 0 0 50 200 400 200 96.36 90.21 107.23
a. Were any of the prices outliers? Explain how you made your decision.
b. One of the manufacturers advertises a cellphone "economy-priced at only $31.95".
Would you consider that to be a very low price? Explain.
(Essay)
5.0/5 (44)
The following are histograms for the heights of 100 US women and the heights of 100 European women: 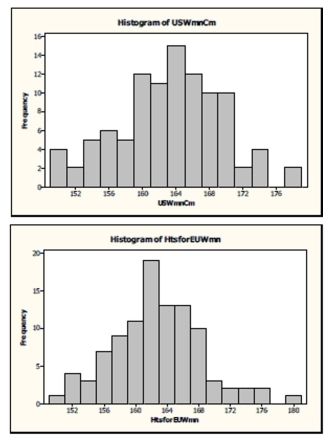 -Compare the two distributions of the women's heights. Be sure to talk about shape, center,
and spread.
-Compare the two distributions of the women's heights. Be sure to talk about shape, center,
and spread.
(Essay)
4.8/5 (42)
Salary conversions You learn that your company is sending you and several other employees to staff a new office in China. While there everyone will earn the equivalent of their current salary, converted to Chinese currency at the rate of 8 yuans per dollar. In addition, everyone will earn a weekly foreign living allowance of 200 yuans. For example, since you are earning $1000 per week, your weekly salary in China will be 1000 x 8 + 200 = 8200 yuans.
a. Shown are some summary statistics describing the current salaries of this group being sent overseas. Fill in the table to show what these statistics will be for the salaries you all will earn while in China. Statistic In the US In China Minimum salary \ 400 Standard deviation \ 250 Median \ 750 IQR \ 300
b. Among this group of employees going to China, your US salary has a z-score of . What will your new -score be, based on everyone's China salary?
(Essay)
4.8/5 (31)
The following are histograms for the heights of 100 US women and the heights of 100 European women: 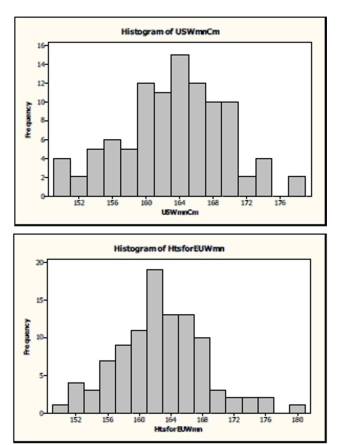 -While the scales of the histograms are the same, there is something that could be improved
so that we could compare these two distributions better. Identify this improvement and
explain why it would be better.
-While the scales of the histograms are the same, there is something that could be improved
so that we could compare these two distributions better. Identify this improvement and
explain why it would be better.
(Essay)
4.9/5 (40)
Repair bills An automobile service shop reported the summary statistics shown for repair
bills (in $) for their customers last month. Min 27 Q1 88 Median 132 Q3 308 Max 1442 Mean 284 SD 140
a. Were any of the bills outliers? Show how you made your decision.
b. After checking out a problem with your car the service manager gives you an estimate of
"only $90." Is he right to imply that your bill will be unusually low? Explain briefly.
(Essay)
4.8/5 (40)
The best estimate of the standard deviation of the mens' weights displayed in this dotplot is 
(Multiple Choice)
4.9/5 (42)
A statistics teacher gave her class a 15 point quiz. The summary statistics for the students'
scores are shown in the table. 10.95 points s 2.481 points min 4 Q1 9.5 median 12 Q3 12 15
a. Notice that the median score and the third quartile are the same. Explain how this can
be.
b. One student's parent heaped praise on him for scoring 13, saying it was an amazing
score. Comment on whether that praise is deserved using the summary statistics as
support.
c. To convert these raw scores to a score out of 100, the teacher multiplies each score by six,
then adds 10. (We can debate the wisdom of such a strategy later!). What is the median
converted score? And the IQR?
d. What are the mean and standard deviation of the converted test scores?
(Essay)
4.9/5 (38)
Hardwood mulch Hardwood mulch is sold by the cubic yard. (But they just call it 'yards'
to be confusing.) One lawn and garden store has a truck that they say can carry up to 7
yards for delivery. (It can actually hold a bit more.) Of course, when they fill the truck they
don't get exactly 7 yards of mulch. They weigh it to determine the actual amount for billing
purposes. They charge $28 per yard for the mulch, plus $25 for delivery
a. Shown are some summary statistics describing the distribution of the actual amounts of
mulch in full loads. Fill in the table to include those statistics for the cost including
delivery. Statistic Yards Of Mulch Cost incl. Delivery Mean 7.1 Standard deviation 0.18 Q1 6.8 Median 7.2 IQR 0.5
b. Your delivery is among this set of data, and it has a
4 for the distribution
of yards of mulch. What is your z-score for the cost including delivery?
(Essay)
4.7/5 (36)
Light bulbs are measured in lumens (light output), watts (energy used), and hours (life). A standard white light bulb has a mean life of 675 hours and a standard deviation of 50 hours. A soft white light bulb has a mean life of 700 hours and a standard deviation of 35 hours. At a local science competition, both light bulbs lasted 750 hours. Which light bulb's life span was better? Explain.
(Essay)
4.8/5 (38)
Filters
- Essay(0)
- Multiple Choice(0)
- Short Answer(0)
- True False(0)
- Matching(0)