Exam 1: Exploring and Understanding Data
Exam 1: Exploring and Understanding Data125 Questions
Exam 2: Exploring Relationships Between Variables165 Questions
Exam 3: Gathering Data111 Questions
Exam 4: Randomness and Probability148 Questions
Exam 5: From the Data at Hand to the World at Large128 Questions
Exam 6: Accessing Associations Between Variables93 Questions
Exam 7: Inference When Variables Are Related25 Questions
Exam 8: Regression, Associations, and Predictive Modeling792 Questions
Select questions type
One thousand students from a local university were sampled to gather information such as
gender, high school GPA, college GPA, and total SAT scores. The results were used to create histograms displaying high school grade point averages (GPAs) for both males and females. Compare the grade distribution of males and females. 
(Essay)
4.8/5  (42)
(42)
To determine if people's preference in dogs had changed in the recent years, organizers of a local dog show asked people
who attended the show to indicate which breed was their favorite. This information was compiled by dog breed and gender
of the people who responded. The table summarizes the responses.  -What is the marginal distribution of breeds?
(Essay)
4.9/5 (42)
The distribution below is the number of family members reported by 25 people in the 2010 Census.
The best description for the shape of this distribution is 
(Multiple Choice)
4.9/5 (35)
There are 18 roller coasters in Virginia for which the lengths (in feet) were reported. Those lengths are listed in the table. 1385 2757 2835 2231 3828 1312 3369 3240 5100 3157 2700 600 3150 3108 2705 4210 4882 1960
-a. Sketch a histogram for these data.
b. Find the mean and standard deviation of the roller coaster lengths.
c. Is it appropriate to use the mean and standard deviation to summarize these data?
Explain.
d. Describe the distribution of roller coaster lengths.
(Essay)
4.9/5 (42)
Veterinary costs Costs for standard veterinary services at a local animal hospital follow a
Normal model with a mean of $80 and a standard deviation of $20.
a. Draw and clearly label this model. 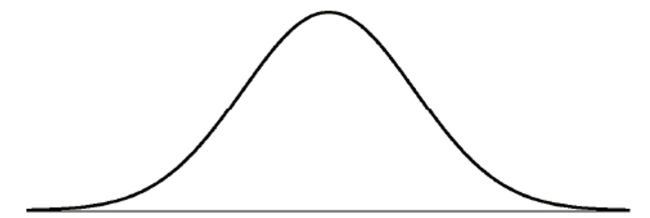 b. Is it unusual to have a veterinary bill for $125? Explain.
c. What is the IQR for the costs of standard veterinary services? Show your work
b. Is it unusual to have a veterinary bill for $125? Explain.
c. What is the IQR for the costs of standard veterinary services? Show your work
(Essay)
5.0/5 (36)
The boxplots show the age of people involved in accidents according to their role in the accident.  a. Which role involved the youngest person, and what is the age?
b. Which role had the lowest median age, and what is the age?
c. Which role had smallest range of ages, and what is it?
d. Which role had the largest IQR of ages, and what is it?
e. Which role generally involves the oldest people? Explain.
a. Which role involved the youngest person, and what is the age?
b. Which role had the lowest median age, and what is the age?
c. Which role had smallest range of ages, and what is it?
d. Which role had the largest IQR of ages, and what is it?
e. Which role generally involves the oldest people? Explain.
(Essay)
4.9/5 (37)
A research company frequently monitors trends in the use of social media by American Adults. The results of one survey of 1846 randomly selected adults looked at social media use versus age group. The table summarizes the survey results.  -What is the marginal distribution of age groups?
(Essay)
4.9/5 (35)
The SPCA collects the following data about the dogs they house. Which is categorical?
(Multiple Choice)
4.9/5 (35)
Dimes minted in the United States average 2.286 g with a standard deviation of 0.06 g.
Nickels have a mean of 5.000 g and a standard deviation of about 0.08 g. A couple
chemistry students were trying out their teacher's new scale by weighing a bunch of coins.
They found a nickel that weighed 5.19 g and a dime that weighed 2.45 g. Which coin was
more exceptionally heavy? Explain.
(Essay)
4.8/5 (36)
To determine if people's preference in dogs had changed in the recent years, organizers of a local dog show asked people who attended the show to indicate which breed was their favorite. This information was compiled by dog breed and gender of the people who responded. The table summarizes the responses.  -Identify the variables and tell whether each is categorical or quantitative.
(Short Answer)
4.9/5 (32)
House calls A local plumber makes house calls. She charges $30 to come out to the house
and $40 per hour for her services. For example, a 4-hour service call costs $30 + $40(4) =
$190.
a. The table shows summary statistics for the past month. Fill in the table to find out the
cost of the service calls. Statistic Hours of Service Call Cost of Service Call Mean 4.5 Median 3.5 SD 1.2 IQR 2.0 Minimum 0.5
b. This past month, the time the plumber spent on one service call corresponded to a
0. What was the z-score for the cost of that service call?
(Essay)
4.8/5 (31)
The ages of people attending the opening show of a new movie are summarized in the ogive
Shown. Estimate the IQR of the ages. 
(Multiple Choice)
4.8/5 (40)
If we want to discuss any gaps and clusters in a data set, which of the following should not be
Chosen to display the data set?
(Multiple Choice)
4.8/5 (40)
Which of the following summaries are changed by adding a constant to each data value?
I. the mean
II. the median
III. the standard deviation
(Multiple Choice)
4.8/5 (33)
Suppose a Normal model describes the number of pages printer ink cartridges last. If we keep track
Of printed pages for the 47 printers at a company's office, which must be true?
I. The page counts for those ink cartridges will be normally distributed.
II. The histogram for those page counts will be symmetric.
III. 95% of those page counts will be within 2 standard deviations of the mean.
(Multiple Choice)
4.7/5 (28)
There are 18 roller coasters in Virginia for which the lengths (in feet) were reported. Those lengths are listed in the table. 1385 2757 2835 2231 3828 1312 3369 3240 5100 3157 2700 600 3150 3108 2705 4210 4882 1960
-There is a proposal to replace the shortest roller coaster above with one that has a length of
1,200 ft. Indicate whether changing that roller coaster's length would make each of these
summary statistics increase, decrease, or stay about the same.
a. mean
b. median
c. range
d. IQR
e. standard deviation
(Essay)
4.8/5 (29)
Has the percentage of young girls drinking milk changed over time? The following table is consistent with the results from
"Beverage Choices of Young Females: Changes and Impact on Nutrient Intakes" (Shanthy A. Bowman, Journal of the American
Dietetic Association, 102(9), pp. 1234-1239): 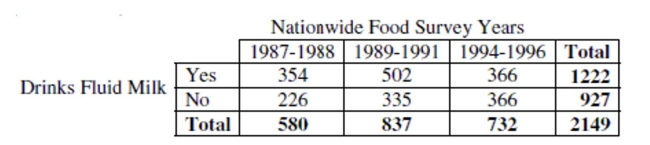 -What is the marginal distribution of milk consumption?
(Short Answer)
4.8/5 (34)
Which is true of the data whose distribution is shown?
I. The distribution is skewed to the right.
II. The mean is probably smaller than the median.
III. We should summarize with mean and standard deviation.
(Multiple Choice)
4.8/5 (38)
In order to plan transportation and parking needs at a private high school, administrators asked students how they get to
school. Some rode a school bus, some rode in with parents or friends, and others used "personal" transportation - bikes,
skateboards, or just walked. The table summarizes the responses from boys and girls. 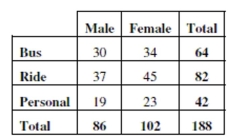 -Which of the W's are unknown for these data?
(Essay)
4.9/5 (41)
Commuting to work The table shows how a company's employees commute to work. 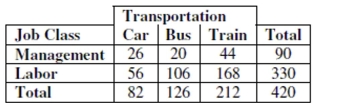 a. What is the marginal distribution (in %) of mode of transportation (Car, Bus, Train)?
b. What is the conditional distribution (in %) of mode of transportation (Car, Bus, Train) for
management?
c. What kind of display would you use to show the association between job class and mode
of transportation? (Just name a graph.)
d. Do job classification and mode of transportation appear to be independent? Give
statistical evidence to support your conclusion.
a. What is the marginal distribution (in %) of mode of transportation (Car, Bus, Train)?
b. What is the conditional distribution (in %) of mode of transportation (Car, Bus, Train) for
management?
c. What kind of display would you use to show the association between job class and mode
of transportation? (Just name a graph.)
d. Do job classification and mode of transportation appear to be independent? Give
statistical evidence to support your conclusion.
(Essay)
4.9/5 (31)
Filters
- Essay(0)
- Multiple Choice(0)
- Short Answer(0)
- True False(0)
- Matching(0)