Exam 6: Normal Probability Distributions
Exam 1: Introduction to Statistics85 Questions
Exam 2: Summarizing and Graphing Data82 Questions
Exam 3: Statistics for Describing, Exploring, and Comparing Data149 Questions
Exam 4: Probability170 Questions
Exam 5: Probability Distributions158 Questions
Exam 6: Normal Probability Distributions173 Questions
Exam 7: Estimates and Sample Sizes139 Questions
Exam 8: Hypothesis Testing130 Questions
Exam 9: Inferences From Two Samples105 Questions
Exam 10: Correlation and Regression129 Questions
Exam 11: Multinomial Experiments and Contingency Tables31 Questions
Exam 12: Analysis of Variance60 Questions
Exam 13: Nonparametric Statistics64 Questions
Exam 14: Statistical Process Control38 Questions
Select questions type
Provide an appropriate response.
-SAT verbal scores are normally distributed with a mean of 430 and a standard deviation of 120 (based on data from the College Board ATP). (a)If a single student is randomly selected, find the probability that the sample mean is above 500. (b)If a sample of 35 students are selected randomly, find the probability that the sample mean is above 500. These two problems appear to be very similar. Which problem requires the application of the Central Limit theorem, and in what way does the solution process differ between the two problems?
(Essay)
4.8/5  (37)
(37)
In a certain population, 10% of people are left handed. Suppose that in calculating each of the probabilities below, you use the normal distribution as an approximation to the binomial but that you fail to use a continuity correction. In which case will the resulting error be the greatest? In which case will the error be the least? Explain your thinking. A: the probability that among 50 randomly selected people, at least 5 are left handed B: the probability that among 100 randomly selected people, more than 10 are left handed C: the probability that among 200 randomly selected people, at most 20 are left handed
(Essay)
4.9/5 (31)
Solve the problem.
-The annual precipitation amounts in a certain mountain range are normally distributed with a mean of 91 inches, and a standard deviation of 14 inches. What is the probability that the mean annual precipitation during 49 randomly picked years will be less than 93.8 inches?
(Multiple Choice)
5.0/5 (35)
Solve the problem.
-The amount of rainfall in January in a certain city is normally distributed with a mean of 4.6 inches and a standard deviation of 0.3 inches. Find the value of the quartile
(Multiple Choice)
4.8/5 (38)
The weekly salaries of teachers in one state are normally distributed with a mean of $490 and a standard deviation of $45. What is the probability that a randomly selected teacher earns more than $525 a week?
(Multiple Choice)
4.9/5 (34)
Assume that X has a normal distribution, and find the indicated probability.
-The mean is and the standard deviation is . Find the probability that is between and 16.1.
(Multiple Choice)
4.7/5 (29)
Estimate the indicated probability by using the normal distribution as an approximation to the binomial distribution.
-A certain question on a test is answered correctly by 22% of the respondents. Estimate the probability that among the next 150 responses there will be at most 40 correct answers.
(Multiple Choice)
4.8/5 (43)
The Precision Scientific Instrument Company manufactures thermometers that are supposed to give readings of 0°C at the freezing point of water. Tests on a large sample of these thermometers reveal that at the freezing point of water, some give readings below 0°C (denoted by negative numbers) and some give readings above 0°C (denoted by positive numbers). Assume that the mean reading is 0°C and the standard deviation of the readings is 1.00°C. Also assume that the frequency distribution of errors closely resembles the normal distribution. A thermometer is randomly selected and tested. Find the temperature reading corresponding to the given information.
-Find P96, the 96th percentile.
(Multiple Choice)
4.7/5 (33)
Provide an appropriate response.
-Describe in detail the sampling distribution of sample means. Refer specifically to the shape of the distribution.
(Essay)
4.9/5 (37)
Using the following uniform density curve, answer the question. 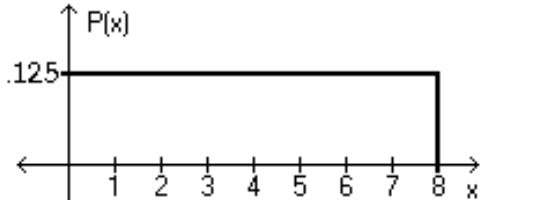 -What is the probability that the random variable has a value between 0.7 and 0.8?
(Multiple Choice)
4.9/5 (38)
Provide an appropriate response.
-Define a standard normal distribution by identifying its shape and the numeric values for its mean and standard deviation. Mark the mean and the standard deviations on the curve. What do z scores measure? Relate the concept of z scores to the Empirical Rule.
(Essay)
4.9/5 (39)
Assume that the weight loss for the first month of a diet program varies between 6 pounds and 12 pounds, and is spread evenly over the range of possibilities, so that there is a uniform distribution. Find the probability of the given range of pounds lost
-What is the probability that the random variable has a value between 4.5 and 7.7?
(Multiple Choice)
4.8/5 (36)
Solve the problem.
-Assume that scores are normally distributed with a mean of 0 and a standard deviation of 1 . If , find .
(Multiple Choice)
4.8/5 (41)
For the binomial distribution with the given values for n and p
-n = 15 and p = .2
(Multiple Choice)
4.9/5 (46)
Solve the problem.
-Assume that women have heights that are normally distributed with a mean of 63.6 inches and a standard deviation of 2.5 inches. Find the value of the quartile Q
(Multiple Choice)
4.8/5 (38)
Identify the probability of each sample, and describe the sampling distribution of the sample means.
-Personal phone calls received in the last three days by a new employee were 2, 6, and 8. Assume that samples of size 2 are randomly selected with replacement from this population of three values.
(Multiple Choice)
4.9/5 (32)
Assume that X has a normal distribution, and find the indicated probability.
-The mean is and the standard deviation is . Find the probability that is greater than .
(Multiple Choice)
4.9/5 (44)
The volumes of soda in quart soda bottles are normally distributed with a mean of 32.3 oz and a standard deviation of 1.2 oz. What is the probability that the volume of soda in a randomly selected bottle will be less than 32 oz?
(Multiple Choice)
4.8/5 (37)
If Z is a standard normal variable, find the probability
-The probability that Z lies between 0 and 3.01
(Multiple Choice)
4.8/5 (36)
Provide an appropriate response.
-The typical computer random-number generator yields numbers in a uniform distribution between 0 and 1 with a mean of 0.500 and a standard deviation of 0.289. (a)Suppose a sample of size 50 is randomly generated. Find the probability that the mean is below 0.300. (b)Suppose a sample size of 15 is randomly generated. Find the probability that the mean is below 0.300. These two problems appear to be very similar. Only one can be solved by the Central Limit theorem. Which one and why?
(Essay)
4.8/5 (38)
Filters
- Essay(0)
- Multiple Choice(0)
- Short Answer(0)
- True False(0)
- Matching(0)