Exam 6: Normal Probability Distributions
Exam 1: Introduction to Statistics85 Questions
Exam 2: Summarizing and Graphing Data82 Questions
Exam 3: Statistics for Describing, Exploring, and Comparing Data149 Questions
Exam 4: Probability170 Questions
Exam 5: Probability Distributions158 Questions
Exam 6: Normal Probability Distributions173 Questions
Exam 7: Estimates and Sample Sizes139 Questions
Exam 8: Hypothesis Testing130 Questions
Exam 9: Inferences From Two Samples105 Questions
Exam 10: Correlation and Regression129 Questions
Exam 11: Multinomial Experiments and Contingency Tables31 Questions
Exam 12: Analysis of Variance60 Questions
Exam 13: Nonparametric Statistics64 Questions
Exam 14: Statistical Process Control38 Questions
Select questions type
Solve the problem.
-The weights of certain machine components are normally distributed with a mean of 8.05 g and a standard deviation of 0.09 g. Find the two weights that separate the top 3% and the bottom 3%. Theses weights could serve as limits used to identify which components should be rejected.
(Multiple Choice)
4.9/5  (40)
(40)
Assume that X has a normal distribution, and find the indicated probability.
-The mean is and the standard deviation is . Find the probability that is less than .
(Multiple Choice)
4.9/5 (46)
Solve the problem.
-A final exam in Math 160 has a mean of 73 with standard deviation 7.8. If 24 students are randomly selected, find the probability that the mean of their test scores is less than 76.
(Multiple Choice)
4.8/5 (49)
Using the following uniform density curve, answer the question. 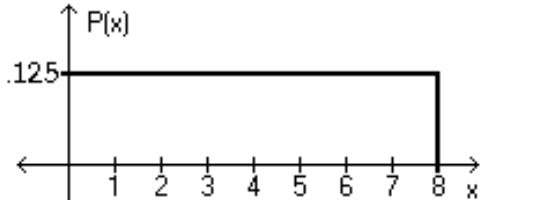 -What is the probability that the random variable has a value greater than 3?
(Multiple Choice)
4.9/5 (38)
The Precision Scientific Instrument Company manufactures thermometers that are supposed to give readings of 0°C at the freezing point of water. Tests on a large sample of these thermometers reveal that at the freezing point of water, some give readings below 0°C (denoted by negative numbers) and some give readings above 0°C (denoted by positive numbers). Assume that the mean reading is 0°C and the standard deviation of the readings is 1.00°C. Also assume that the frequency distribution of errors closely resembles the normal distribution. A thermometer is randomly selected and tested. Find the temperature reading corresponding to the given information.
-
(Multiple Choice)
4.8/5 (29)
Solve the problem.
-Human body temperatures are normally distributed with a mean of 98.20°F and a standard deviation of 0.62°F. Find the temperature that separates the top 7% from the bottom 93%.
(Multiple Choice)
4.7/5 (36)
Scores on a test have a mean of 73 and is 80. The scores have a distribution that is approximately normal.
Find P90. (You will need to first find the standard deviation.)
(Multiple Choice)
4.9/5 (46)
If Z is a standard normal variable, find the probability
-The probability that Z lies between -1.10 and -0.36
(Multiple Choice)
4.9/5 (36)
Provide an appropriate response.
-Consider the uniform distribution shown below. Find the probability that x is greater than 6. Discuss the relationship between area under a density curve and probability. 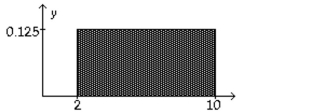
(Essay)
5.0/5 (30)
The Precision Scientific Instrument Company manufactures thermometers that are supposed to give readings of 0°C at the freezing point of water. Tests on a large sample of these thermometers reveal that at the freezing point of water, some give readings below 0°C (denoted by negative numbers) and some give readings above 0°C (denoted by positive numbers). Assume that the mean reading is 0°C and the standard deviation of the readings is 1.00°C. Also assume that the frequency distribution of errors closely resembles the normal distribution. A thermometer is randomly selected and tested. Find the temperature reading corresponding to the given information.
-If 7% of the thermometers are rejected because they have readings that are too high, but all other thermometers are acceptable, find the temperature that separates the rejected thermometers from the others.
(Multiple Choice)
4.8/5 (39)
Using the following uniform density curve, answer the question.
-What is the probability that the random variable has a value less than 2.1?
(Multiple Choice)
5.0/5 (37)
A history teacher assigns letter grades on a test according to the following scheme: A: Top 10% B: Scores below the top 10% and above the bottom 60% C: Scores below the top 40% and above the bottom 20% D: Scores below the top 80% and above the bottom 10% F: Bottom 10% Scores on the test are normally distributed with a mean of 69 and a standard deviation of 13.4. Find the numerical limits for each letter grade.
(Multiple Choice)
4.8/5 (41)
The diameters of pencils produced by a certain machine are normally distributed with a mean of 0.30 inches and a standard deviation of 0.01 inches. What is the probability that the diameter of a randomly selected pencil will be less than 0.285 inches?
(Multiple Choice)
4.9/5 (33)
Filters
- Essay(0)
- Multiple Choice(0)
- Short Answer(0)
- True False(0)
- Matching(0)