Exam 6: Normal Probability Distributions
Exam 1: Introduction to Statistics85 Questions
Exam 2: Summarizing and Graphing Data82 Questions
Exam 3: Statistics for Describing, Exploring, and Comparing Data149 Questions
Exam 4: Probability170 Questions
Exam 5: Probability Distributions158 Questions
Exam 6: Normal Probability Distributions173 Questions
Exam 7: Estimates and Sample Sizes139 Questions
Exam 8: Hypothesis Testing130 Questions
Exam 9: Inferences From Two Samples105 Questions
Exam 10: Correlation and Regression129 Questions
Exam 11: Multinomial Experiments and Contingency Tables31 Questions
Exam 12: Analysis of Variance60 Questions
Exam 13: Nonparametric Statistics64 Questions
Exam 14: Statistical Process Control38 Questions
Select questions type
For the binomial distribution with the given values for n and p
-n = 12 and p = .5
(Multiple Choice)
4.9/5  (32)
(32)
Solve the problem.
-Assume that scores are normally distributed with a mean of 0 and a standard deviation of 1 . If , find .
(Multiple Choice)
4.8/5 (36)
Solve the problem.
-In a population of 225 women, the heights of the women are normally distributed with a mean of 64.5 inches and a standard deviation of 2.9 inches. If 25 women are selected at random, find the probability that their mean height will exceed 66 inches. Assume that the sampling is done without replacement and use a finite population correction factor with N = 225.
(Multiple Choice)
4.9/5 (30)
Use the continuity correction and describe the region of the normal curve that corresponds to the indicated binomial probability.
-The probability of fewer than 43 democrats
(Multiple Choice)
4.8/5 (42)
Provide an appropriate response.
-Sketch a brief diagram of the standard normal distribution table. You only need to show two sets of values. Identify the z scores and the area scores in the table by circling the scores and writing z score and area by each one. Describe how to find the area corresponding to a given z score. Describe how to find the the z score corresponding to a given area value.
(Essay)
5.0/5 (35)
List the different possible samples, and find the mean of each of them
-Personal phone calls received in the last three days by a new employee were 3, 1, and 8. Assume that samples of size 2 are randomly selected with replacement from this population of three values.
(Essay)
4.9/5 (48)
Solve the problem.
-A study of the amount of time it takes a mechanic to rebuild the transmission for a 1992 Chevrolet Cavalier shows that the mean is 8.4 hours and the standard deviation is 1.8 hours. If 40 mechanics are randomly selected, find the probability that their mean rebuild time exceeds 8.1 hours.
(Multiple Choice)
4.9/5 (43)
A poll of 1200 randomly selected students in grades 6 through 8 was conducted and found that 39% enjoy playing sports. What is the sampling distribution suggested by the given data?
(Essay)
4.9/5 (31)
A normal probability plot is given below for a sample of scores on an aptitude test. Use the plot to assess the normality of scores on this test. Explain your reasoning. 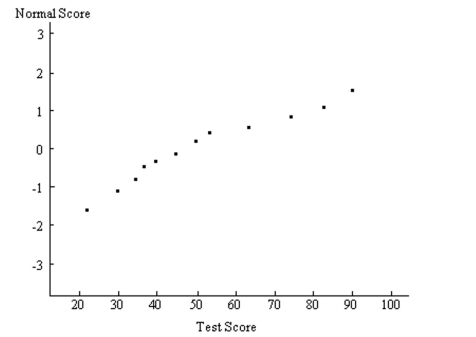
(Essay)
4.9/5 (38)
Construct a normal probability plot of the given data. Use your plot to determine whether the data come from a normally distributed population
-The ages of 30 students selected randomly from one college are as follows: 21 23 20 24 20 19 20 19 22 32 20 24 26 21 37 23 18 34 25 30 22 24 23 19 28 20 29 21 35 25 20 21 28 22 32
(Essay)
4.9/5 (38)
Use the continuity correction and describe the region of the normal curve that corresponds to the indicated binomial probability.
-The probability of exactly 37 green marbles
(Multiple Choice)
4.8/5 (35)
Scores on a test have a mean of 62 and is 84. The scores have a distribution that is approximately normal. Find the standard deviation. Round your answer to the nearest tenth.
(Multiple Choice)
4.8/5 (24)
The Precision Scientific Instrument Company manufactures thermometers that are supposed to give readings of 0°C at the freezing point of water. Tests on a large sample of these thermometers reveal that at the freezing point of water, some give readings below 0°C (denoted by negative numbers) and some give readings above 0°C (denoted by positive numbers). Assume that the mean reading is 0°C and the standard deviation of the readings is 1.00°C. Also assume that the frequency distribution of errors closely resembles the normal distribution. A thermometer is randomly selected and tested. Find the temperature reading corresponding to the given information.
-P(-0.73 < Z < 2.27)
(Multiple Choice)
4.9/5 (42)
Identify the probability of each sample, and describe the sampling distribution of the sample means.
-The number of books sold over the course of the four-day book fair were 189, 167, 271, and 83. Assume that samples of size 2 are randomly selected with replacement from this population of four values.
(Multiple Choice)
4.9/5 (51)
If Z is a standard normal variable, find the probability
-The probability that Z lies between 0.7 and 1.98
(Multiple Choice)
4.8/5 (41)
Solve the problem.
-A final exam in Math 160 has a mean of 73 with standard deviation 7.8. If 24 students are randomly selected, find the probability that the mean of their test scores is less than 70.
(Multiple Choice)
4.9/5 (42)
Estimate the indicated probability by using the normal distribution as an approximation to the binomial distribution.
-n = 38 and p = .9
(Multiple Choice)
4.8/5 (38)
If Z is a standard normal variable, find the probability
-The probability that Z lies between -0.55 and 0.55
(Multiple Choice)
4.8/5 (35)
Find the probability that in 200 tosses of a fair die, we will obtain at most 30 fives.
(Multiple Choice)
4.9/5 (37)
Solve the problem.
-In one region, the September energy consumption levels for single-family homes are found to be normally distributed with a mean of 1050 kWh and a standard deviation of 218 kWh. If 50 different homes are randomly selected, find the probability that their mean energy consumption level for September is greater than 1075 kWh.
(Multiple Choice)
4.8/5 (31)
Filters
- Essay(0)
- Multiple Choice(0)
- Short Answer(0)
- True False(0)
- Matching(0)