Exam 3: Relationships Between Categorical Variablescontingency Tables
Exam 1: Stats Starts Here16 Questions
Exam 2: Displaying and Describing Data16 Questions
Exam 3: Relationships Between Categorical Variablescontingency Tables19 Questions
Exam 4: Understanding and Comparing Distributions16 Questions
Exam 5: The Standard Deviation As a Ruler and the Normal Model18 Questions
Exam 6: Scatterplots, Association, and Correlation19 Questions
Exam 7: Linear Regression18 Questions
Exam 8: Regression Wisdom17 Questions
Exam 9: Multiple Regression16 Questions
Exam 10: Sample Surveys19 Questions
Exam 11: Experiments and Observational Studies17 Questions
Exam 12: From Randomness to Probability2 Questions
Exam 13: Probability Rules5 Questions
Exam 14: Random Variables6 Questions
Exam 15: Probability Models6 Questions
Exam 17: Confidence Intervals for Means17 Questions
Exam 18: Testing Hypotheses17 Questions
Exam 19: More About Tests and Intervals17 Questions
Exam 20: Comparing Groups18 Questions
Exam 21: Paired Samples and Blocks15 Questions
Exam 22: Comparing Counts17 Questions
Exam 23: Inferences for Regression16 Questions
Exam 26: Multifactor Analysis of Variance2 Questions
Select questions type
A regional survey was carried out to gauge public opinion on the controversial Arizona Immigration Law (results shown below).How many respondents are Republican and favor
The law? Response Democrat Republican Independent Favor 50 93 35 Oppose 85 45 60 Don't Know 5 7 20
Free
(Multiple Choice)
4.8/5  (25)
(25)
Correct Answer: Verified
A
A regional survey was carried out to gauge public opinion on the controversial Arizona Immigration Law (results shown below).What percent oppose the law? Response Democrat Republican Independent Favor 50 93 35 Oppose 85 45 60 Don't Know 5 7 20
Free
(Multiple Choice)
4.9/5 (45)
Correct Answer:Verified
A
A regional survey was carried out to gauge public opinion on the controversial Arizona Immigration Law.The results are displayed in the segmented bar chart below.Which of the
Following statements is true? 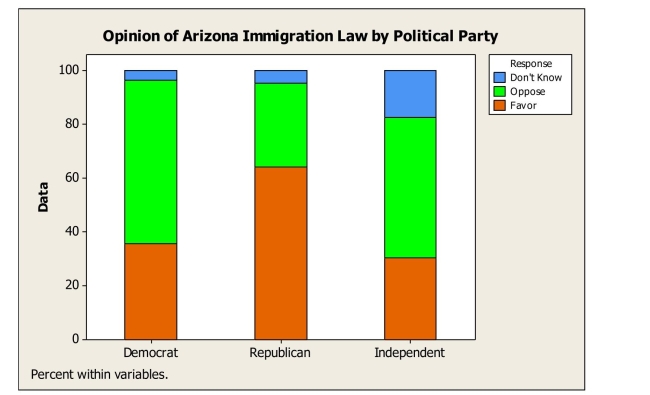
Free
(Multiple Choice)
4.7/5 (35)
Correct Answer:Verified
D
Here is a stacked bar chart for data collected about employee blood pressure. 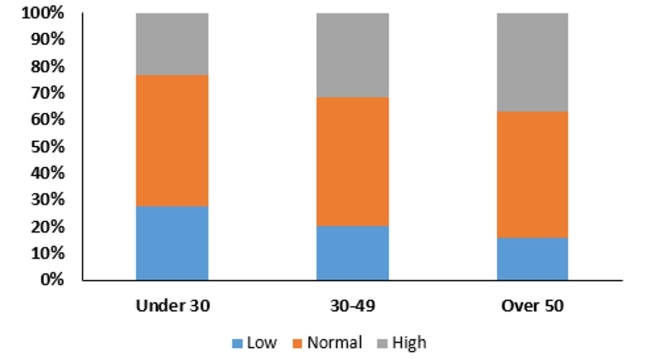 This chart shows
(Multiple Choice)
4.8/5 (41)
A company interested in the health of its employees started a health program including monitoring blood pressure.Based on age, employees were categorized according to ranges of
Blood pressure by age intervals.Data are shown in the table below. 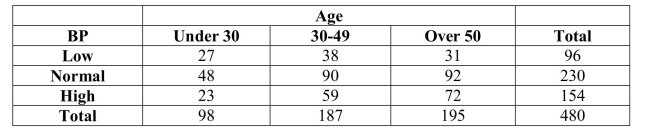 Of all employees, the percentage of those under 50 years old is
(Multiple Choice)
4.9/5 (43)
Accenture, a consulting firm, conducted an online survey of 500 US consumers from in 2013. Response Male Female Too busy to shop earlier 115 75 More time to save for gifts 50 80 Better discounts available 65 20 Part of the holiday tradition 15 5 None of the above 120 60 What percentage of those who thought that better discounts were available on "Black Friday" were female?
(Multiple Choice)
4.7/5 (41)
A regional survey was carried out to gauge public opinion on the controversial Arizona Immigration Law (results shown below).Of respondents who oppose the law, what percent
Is Democrat? Response Democrat Republican Independent Favor 50 93 35 Oppose 85 45 60 Don't Know 5 7 20
(Multiple Choice)
4.7/5 (42)
A company interested in the health of its employees started a health program including monitoring blood pressure.Based on age, employees were categorized according to ranges of
Blood pressure by age intervals.Data are shown in the table below. 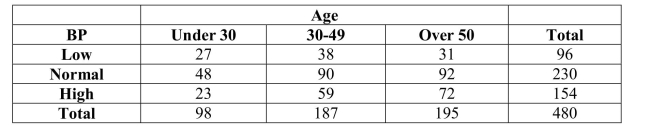 The percentage of employees who are over age 50 and have high blood pressure is
(Multiple Choice)
4.9/5 (41)
The US Census reported the following counts for various education levels by gender in December 2017.. 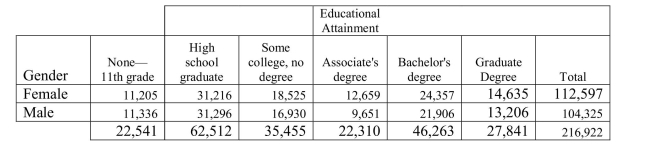 The percentage of females who have attained an Associate's degree is
(Multiple Choice)
4.8/5 (37)
A company interested in the health of its employees started a health program including monitoring blood pressure.Based on age, employees were categorized according to ranges of
Blood pressure by age intervals.Data are shown in the table below. 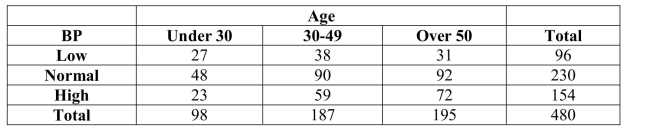 The percentage of employees with normal or low blood pressure is
(Multiple Choice)
4.8/5 (33)
Accenture, a consulting firm, conducted an online survey of 500 US consumers from in 2013. Response Male Female Too busy to shop earlier 115 75 More time to save for gifts 50 80 Better discounts available 65 20 Part of the holiday tradition 15 5 None of the above 120 60 What percentage of men were felt that better discounts were available on "Black Friday"?
(Multiple Choice)
4.9/5 (43)
The following is a bar chart summarizing educational attainment in the US in 2017. 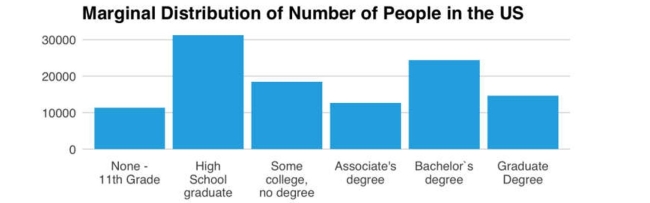 This bar chart shows
(Multiple Choice)
4.7/5 (40)
A regional survey was carried out to gauge public opinion on the controversial Arizona Immigration Law (results shown below).Of respondents who are Democrat, what percent
Oppose the law? Response Democrat Republican Independent Favor 50 93 35 Oppose 85 45 60 ' 5 7 20
(Multiple Choice)
4.9/5 (43)
A regional survey was carried out to gauge public opinion on the controversial Arizona Immigration Law.Based on the results displayed in the table below, what percent of
Respondents is Independent? Response Democrat Republican Independent Favor 50 93 35 Oppose 85 45 60 Don't Know 5 7 20
(Multiple Choice)
4.9/5 (43)
The US Census reported the following counts for various education levels by gender in December 2017.. 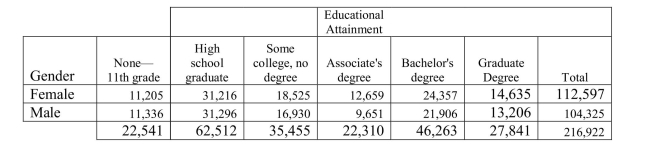 The percentage of those who have attained a Graduate Degree and are male is
(Multiple Choice)
4.9/5 (43)
Based on the side-by-side bar chart summarizing educational attainment by gender, which of the following statement(s) are true? 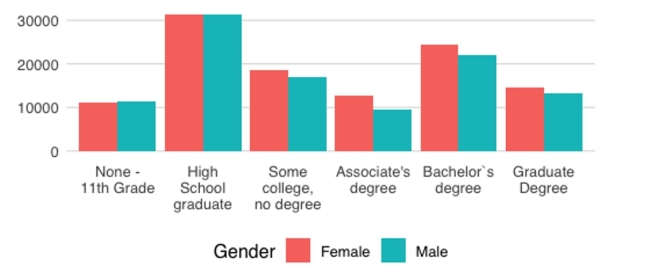
(Multiple Choice)
5.0/5 (36)
In May, 2010, the Pew Research Center for the People & the Press carried out a national survey to gauge opinion on the Arizona Immigration Law.Responses (Favor, Oppose, Don't
Know) were examined according to groups defined by political party affiliation (Democrat,
Republican, Independent).Which of the following would be appropriate for displaying these
Data?
(Multiple Choice)
4.8/5 (41)
A company interested in the health of its employees started a health program including monitoring blood pressure.Based on age, employees were categorized according to ranges of
Blood pressure by age intervals.Data are shown in the table below. 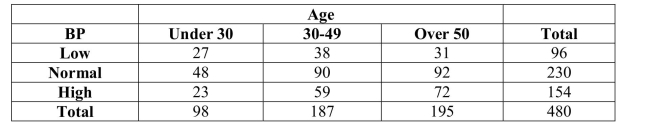 Of all employees, the percentage who are over 50 and have high blood pressure is
(Multiple Choice)
4.7/5 (45)
The US Census reported the following counts for various education levels by gender in December 2017.. 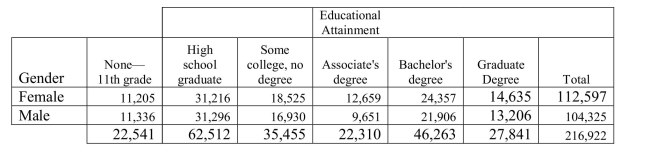 Of those who have attained a Graduate Degree, the percentage of males is
(Multiple Choice)
4.8/5 (44)
Filters
- Essay(0)
- Multiple Choice(0)
- Short Answer(0)
- True False(0)
- Matching(0)