Exam 14: Statistical Process Control
Exam 1: Introduction to Statistics155 Questions
Exam 2: Exploring Data With Tables and Graphs132 Questions
Exam 3: Describing, Exploring, and Comparing Data225 Questions
Exam 4: Probability219 Questions
Exam 5: Discrete Probability Distributions205 Questions
Exam 6: Normal Probability Distributions254 Questions
Exam 7: Estimating Parameters and Determining Sample Sizes170 Questions
Exam 8: Hypothesis Testing187 Questions
Exam 9: Inferences From Two Samples192 Questions
Exam 10: Correlation and Regression174 Questions
Exam 11: Goodness-Of-Fit and Contingency Tables100 Questions
Exam 12: Analysis of Variance113 Questions
Exam 13: Nonparametric Tests121 Questions
Exam 14: Statistical Process Control90 Questions
Select questions type
Examine the given run chart or control chart and determine whether the process is within statistical control. If it
is not, identify which of the three out-of-statistical-control criteria apply. 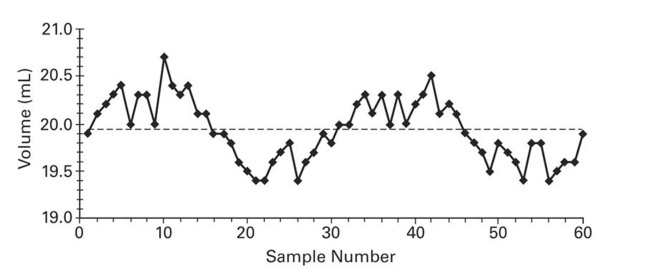
(Essay)
4.8/5  (34)
(34)
Describe a p chart and give an example. What does it attempt to monitor?
(Essay)
4.8/5 (36)
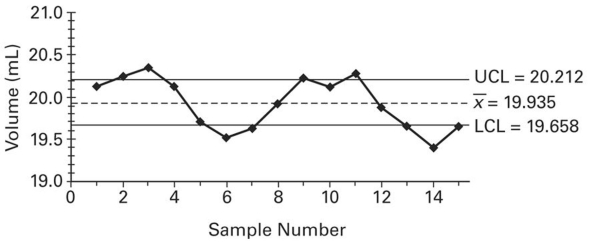
A control chart for is shown below. Determine whether the process mean is within statistical control. If it is not, identify which of the three out-of-control criteria lead to rejection of a statistically stable mean.
(Essay)
5.0/5 (37)
Consider process data consisting of the amounts of potato chips (in ounces) in randomly selected bags of chips. The process is to be monitored with control charts based on samples of 50 bags randomly selected each day for 15 consecutive days of production. What does denote?
(Multiple Choice)
4.9/5 (35)
A machine that is supposed to fill small bottles to contain 20 milliliters yields the following data from a test of 4 bottles every hour. What would be the centerline for a control chart for
? 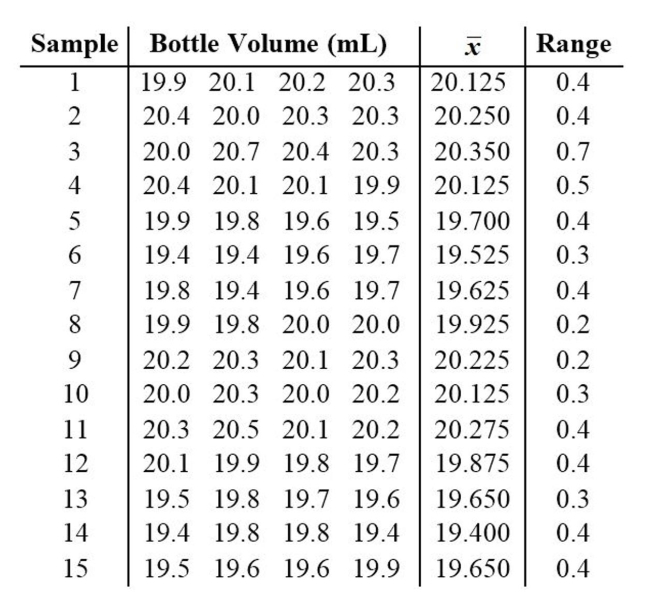
(Multiple Choice)
4.8/5 (32)
A machine is supposed to fill boxes to a weight of 50 pounds. Every 30 minutes a sample of four boxes is tested;
the results are given below. 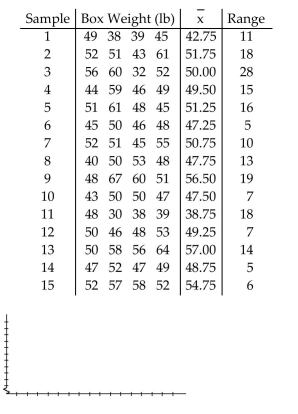
(Essay)
4.8/5 (41)
A drugstore considers a wait of more than 5 minutes to be a defect. Each week 100 customers are randomly
selected and timed at the checkout line. The numbers of defects for 20 consecutive weeks are given below. 4 4 5 5 5 5 5 6 6 6 6 12 6 6 6 7 6 7 8 7
(Essay)
4.9/5 (37)
A control chart for s shown below. Determine whether the process mean is within statistical control. If it is
not, identify which of the three out-of-control criteria lead to rejection of a statistically stable mean. 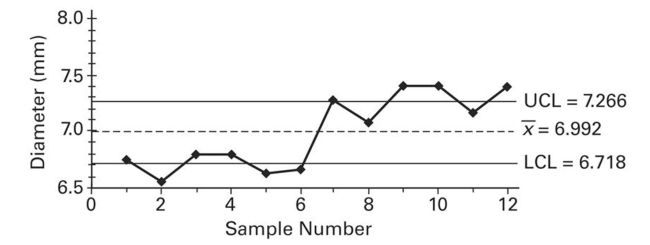
(Essay)
4.7/5 (31)
Define statistically stable (or "within statistical control"). Show examples of run charts which illustrate processes
which are not statistically controlled. Discuss the pattern which indicates the process is not statistically
controlled for each example.
(Essay)
4.8/5 (41)
A control chart for s shown below. Determine whether the process mean is within statistical control. If it is
not, identify which of the three out-of-control criteria lead to rejection of a statistically stable mean. 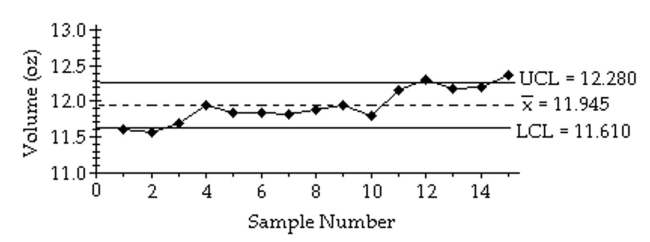
(Essay)
4.8/5 (42)
Construct a run chart for individual values corresponding to the given data. A machine that is supposed to
produce ball bearings with a diameter of 7 millimeters yields the following data from a test of 5 ball bearings
every 20 minutes. 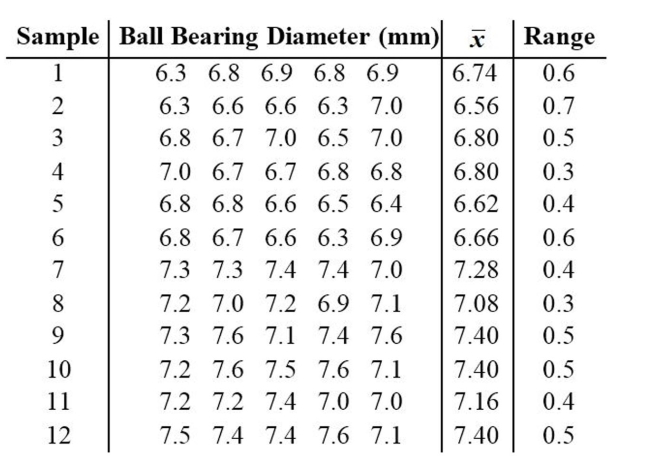
(Essay)
4.9/5 (30)
Provide an appropriate response. A common goal of quality control is to reduce variation in a product or
service. List and describe the two types of variability. Give an example of each.
(Essay)
4.8/5 (35)
A machine is supposed to fill cans that contain 12 ounces. Each hour, a sample of four cans is tested; the results
of 15 consecutive hours are given below. 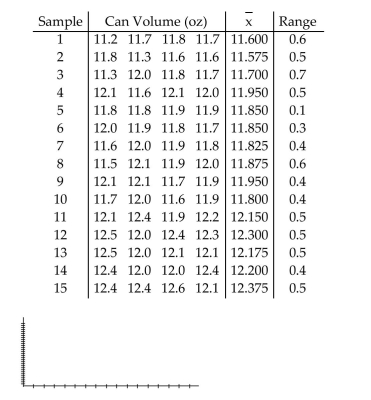
(Essay)
4.9/5 (37)
A control chart for is shown below. Determine whether the process mean is within statistical control. If it is
not, identify which of the three out-of-control criteria lead to rejection of a statistically stable mean. 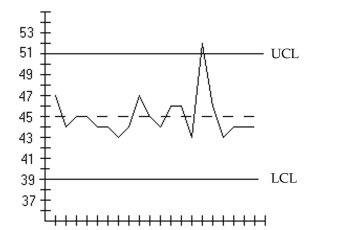
(Essay)
4.9/5 (40)
Describe the three criteria used to determine if a control chart indicates a process which is not statistically stable.
(Essay)
4.8/5 (33)
Examine the given run chart or control chart and determine whether the process is within statistical control. If it
is not, identify which of the three out-of-statistical-control criteria apply. 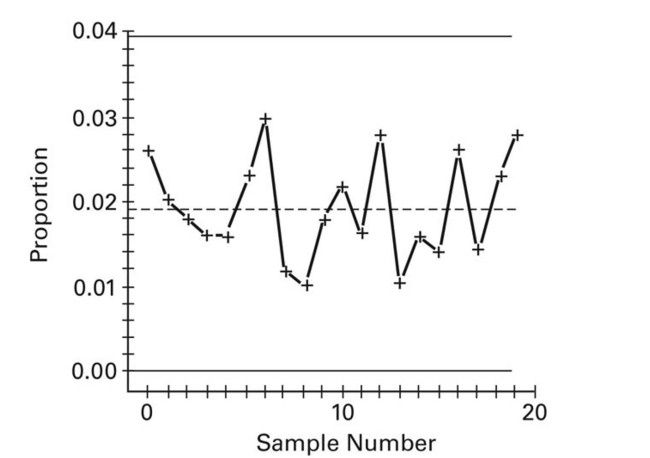
(Essay)
4.9/5 (39)
A run chart for individual values is shown below. Does there appear to be a pattern suggesting that the process
is not within statistical control? If so, describe the pattern. 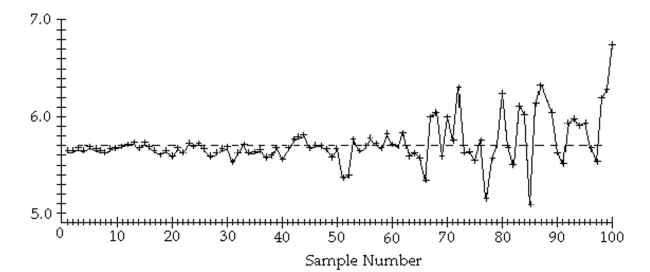
(Essay)
4.8/5 (34)
Examine the given run chart or control chart and determine whether the process is within statistical control. 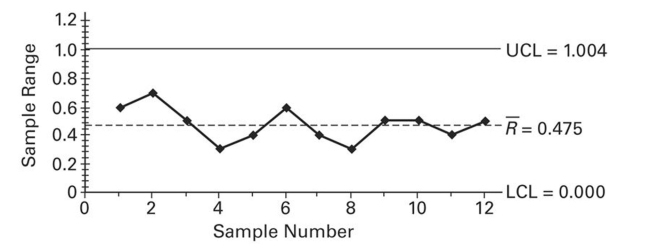
(Multiple Choice)
4.9/5 (30)
A run chart for individual values is shown below. Does there appear to be a pattern suggesting that the process
is not within statistical control? If so, describe the pattern. 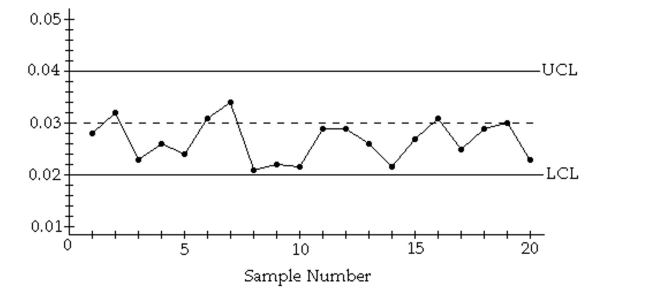
(Essay)
4.8/5 (37)
A control chart for R is shown below. Determine whether the process variation is within statistical control. If it
is not, identify which of the three out-of-control criteria lead to rejection of statistically stable variation. 
(Essay)
4.9/5 (40)
Filters
- Essay(0)
- Multiple Choice(0)
- Short Answer(0)
- True False(0)
- Matching(0)