Exam 14: Statistical Process Control
Exam 1: Introduction to Statistics155 Questions
Exam 2: Exploring Data With Tables and Graphs132 Questions
Exam 3: Describing, Exploring, and Comparing Data225 Questions
Exam 4: Probability219 Questions
Exam 5: Discrete Probability Distributions205 Questions
Exam 6: Normal Probability Distributions254 Questions
Exam 7: Estimating Parameters and Determining Sample Sizes170 Questions
Exam 8: Hypothesis Testing187 Questions
Exam 9: Inferences From Two Samples192 Questions
Exam 10: Correlation and Regression174 Questions
Exam 11: Goodness-Of-Fit and Contingency Tables100 Questions
Exam 12: Analysis of Variance113 Questions
Exam 13: Nonparametric Tests121 Questions
Exam 14: Statistical Process Control90 Questions
Select questions type
Examine the given run chart or control chart and determine whether the process is within statistical control. 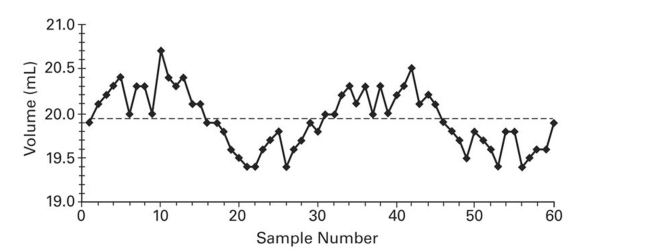
(Multiple Choice)
4.7/5  (35)
(35)
Construct a run chart for individual values corresponding to the given data. A machine is supposed to fill boxes
to a weight of 50 pounds. Every 30 minutes a sample of four boxes is tested; the results are given below. 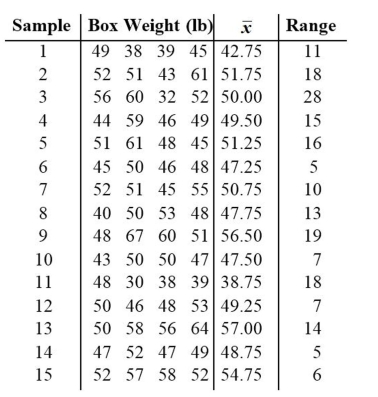
(Essay)
4.9/5 (46)
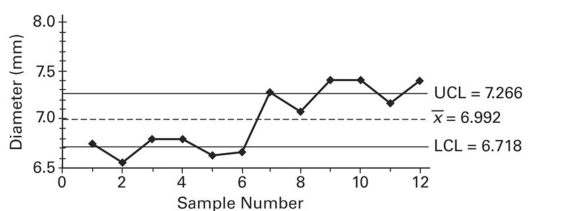
A control chart for is shown below. Determine whether the process mean is within statistical control. If it is not, identify which of the three out-of-control criteria lead to rejection of a statistically stable mean.
(Essay)
4.7/5 (31)
Are control charts based on actual behavior or on desired behavior? Give an example to illustrate the difference
between the two types of behavior.
(Essay)
4.9/5 (37)
Construct an R chart and determine whether the process variation is within statistical control. 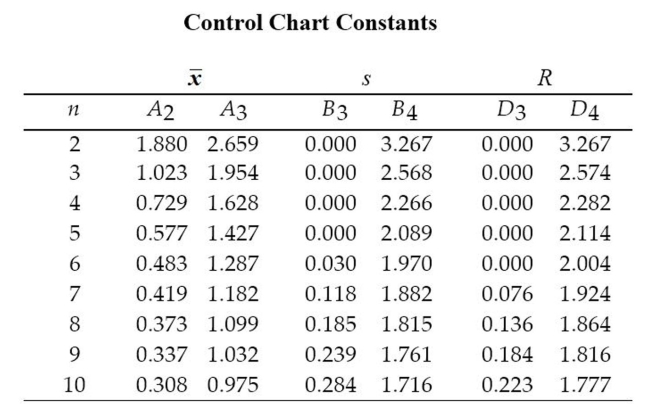 A machine that is supposed to produce ball bearings with a diameter of 7 millimeters yields the following data from a
test of 5 ball bearings every 20 minutes.
A machine that is supposed to produce ball bearings with a diameter of 7 millimeters yields the following data from a
test of 5 ball bearings every 20 minutes. 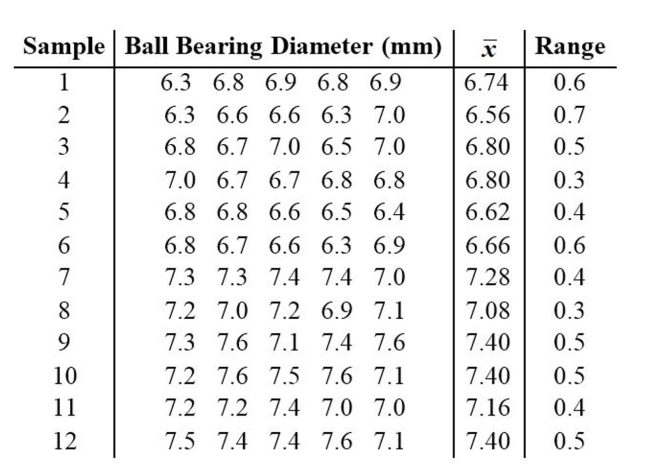
(Essay)
4.9/5 (42)
Use the given process data to construct a control chart for p. A candy manufacturer considers a cracked piece of candy to be a defect. Each day 100 candies are randomly selected and checked for cracks. The numbers of defects for 20
Consecutive days are given below. 14 4 5 5 5 5 5 6 6 6 6 12 6 6 6 7 6 7 8 7 What is the value of the center line?
(Multiple Choice)
4.7/5 (41)
A machine is supposed to fill cans that contain 12 ounces. Each hour, a sample of four cans is tested; the results
of 15 consecutive hours are given below. 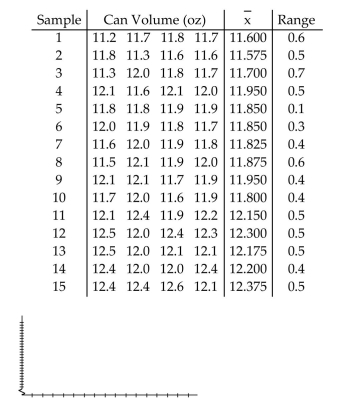
(Essay)
5.0/5 (36)
A machine that is supposed to fill small bottles to contain 20 milliliters yields the following data from a test of 4
bottles every hour. 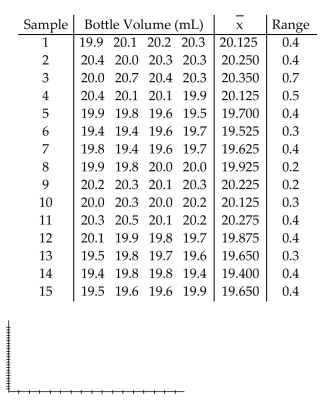
(Essay)
4.8/5 (40)
Control charts are used to monitor changing characteristics of data over ________.
(Multiple Choice)
4.8/5 (40)
Use the given process data to construct a control chart for p. A drugstore considers a wait of more than 5 minutes to be a defect. Each week 100 customers are randomly selected and timed at the checkout line. The numbers of defects for
20 consecutive weeks are given below. 4 4 5 5 5 5 5 6 6 6 6 12 6 6 6 7 6 7 8 7 What is the value of the upper control limit?
(Multiple Choice)
4.8/5 (43)
A machine is supposed to fill cans that contain 12 ounces. Each hour, a sample of four cans is tested; the results
of 15 consecutive hours are given below. 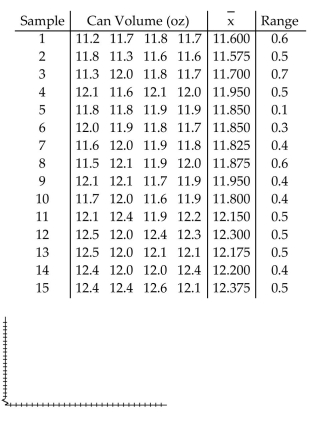
(Essay)
4.8/5 (39)
________ variation results from causes that can be identified.
(Multiple Choice)
4.9/5 (35)
________ data are data arranged according to some sequence. They are a measurement of a characteristic or good or services that result from some combination of equipment, people, materials, methods, and conditions.
(Multiple Choice)
4.8/5 (36)
A common goal of quality control is to reduce variation in a product or service. List and describe the two types
of variability. Give an example of each.
(Essay)
4.8/5 (38)
A control chart for monitoring variation and center can be based on standard deviations instead of on ranges.
An s chart for monitoring variation is made by plotting sample standard deviations with a centerline at (the
mean of the sample standard deviations) and control limits at , where are found in the
Control Chart Constants table. Construct an s chart for the data below.
A manufacturer of lightbulbs picks 10 lightbulbs at random each day for quality control. The mean, standard
deviation, and range (in hours) of the lifetimes of the 10 lightbulbs are calculated. The results for 12 consecutive
days are shown in the table below. Day Range 1 201.1 3.4 1.2 2 203.4 4.7 1.7 3 200.9 3.1 0.9 4 205.6 6.2 2.3 5 201.3 4.7 1.3 6 200.5 3.7 1.7 7 205.8 5.8 2.1 8 203.7 6.2 2.9 9 199.8 2.1 0.8 10 202.7 4.4 1.6 11 200.0 2.7 0.7 12 204.6 7.8 3.0
(Essay)
4.8/5 (42)
Use the given process data to construct a control chart for p. A drugstore considers a wait of more than 5 minutes to
be a defect. Each week 100 customers are randomly selected and timed at the checkout line. The numbers of defects for
20 consecutive weeks are given below. 4 4 5 5 5 5 5 6 6 6 6 12 6 6 6 7 6 7 8 7
(Essay)
4.7/5 (35)
A machine that is supposed to produce ball bearings with a diameter of 7 millimeters yields the following data
from a test of 5 ball bearings every 20 minutes. 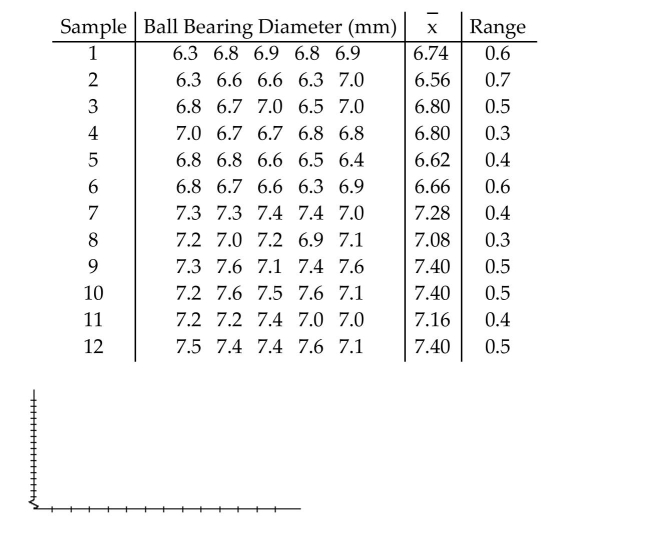
(Essay)
5.0/5 (39)
A machine that is supposed to produce ball bearings with a diameter of 7 millimeters yields the following data
from a test of 5 ball bearings every 20 minutes. 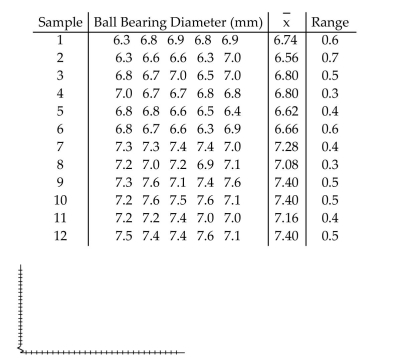
(Essay)
4.7/5 (48)
Filters
- Essay(0)
- Multiple Choice(0)
- Short Answer(0)
- True False(0)
- Matching(0)