Exam 14: Statistical Process Control
Exam 1: Introduction to Statistics155 Questions
Exam 2: Exploring Data With Tables and Graphs132 Questions
Exam 3: Describing, Exploring, and Comparing Data225 Questions
Exam 4: Probability219 Questions
Exam 5: Discrete Probability Distributions205 Questions
Exam 6: Normal Probability Distributions254 Questions
Exam 7: Estimating Parameters and Determining Sample Sizes170 Questions
Exam 8: Hypothesis Testing187 Questions
Exam 9: Inferences From Two Samples192 Questions
Exam 10: Correlation and Regression174 Questions
Exam 11: Goodness-Of-Fit and Contingency Tables100 Questions
Exam 12: Analysis of Variance113 Questions
Exam 13: Nonparametric Tests121 Questions
Exam 14: Statistical Process Control90 Questions
Select questions type
The centerline for a control chart for R consists of ________.
(Multiple Choice)
4.8/5  (34)
(34)
A machine that is supposed to produce ball bearings with a diameter of 7 millimeters yields the following data
from a test of 5 ball bearings every 20 minutes. 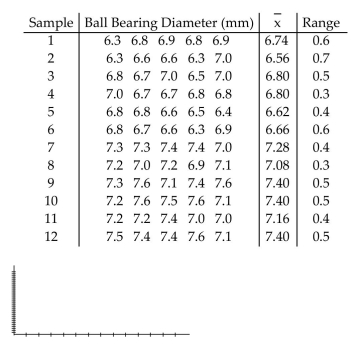
(Essay)
4.9/5 (29)
A control chart for is shown below. Determine whether the process mean is within statistical control. If it is
not, identify which of the three out-of-control criteria lead to rejection of a statistically stable mean. 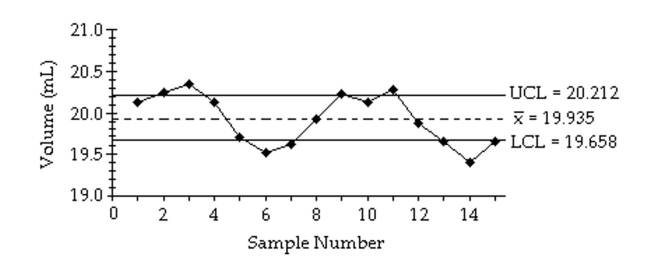
(Essay)
4.8/5 (30)
Provide an appropriate response. Describe what process data are. Why are process data important to
businesses? What is a common goal of businesses using quality control?
(Essay)
4.9/5 (29)
Sketch a run chart that that indicates that a process is not statistically stable due to increasing variation.
(Essay)
4.8/5 (37)
A control chart for R is shown below. Determine whether the process variation is within statistical control. If it
is not, identify which of the three out-of-control criteria lead to rejection of statistically stable variation. 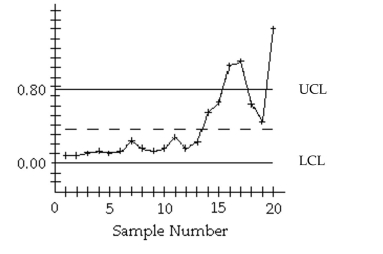
(Essay)
4.8/5 (38)
A manufacturer monitors the level of defects in the television sets that it produces. Each week, 200 television
sets are randomly selected and tested and the number of defects is recorded. The results for 12 consecutive
weeks are shown below. 4 7 5 6 8 3 12 4 4 5 6 2
(Essay)
4.9/5 (42)
Examine the given run chart or control chart and determine whether the process is within statistical control. If it
is not, identify which of the three out-of-statistical-control criteria apply. 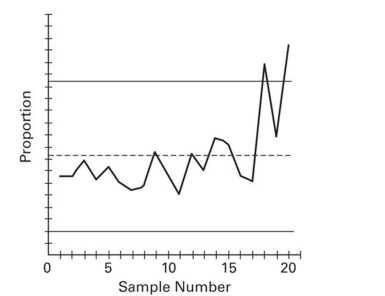
(Essay)
4.8/5 (31)
Use the given process data to construct a control chart for p. If the weight of cereal in a particular packet is less than
14 ounces, the packet is considered nonconforming. Each week, the manufacturer randomly selects 1,000 cereal packets
and determines the number that are nonconforming. The results for 12 consecutive weeks are shown below. 46 32 21 30 47 31 32 52 48 45 62 58
(Essay)
4.8/5 (44)
Examine the given run chart or control chart and determine whether the process is within statistical control. If it
is not, identify which of the three out-of-statistical-control criteria apply. 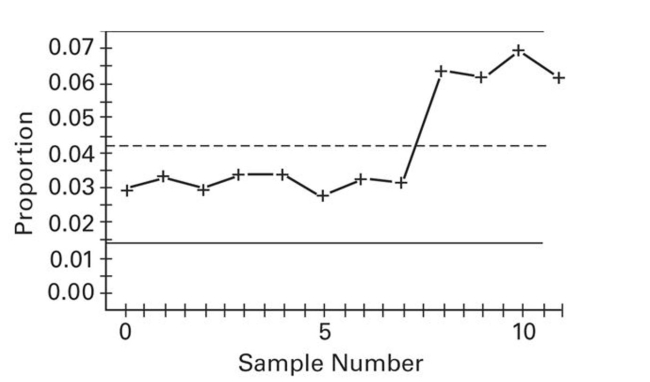
(Essay)
4.9/5 (38)
Filters
- Essay(0)
- Multiple Choice(0)
- Short Answer(0)
- True False(0)
- Matching(0)