Exam 14: Statistical Process Control
Exam 1: Introduction to Statistics155 Questions
Exam 2: Exploring Data With Tables and Graphs132 Questions
Exam 3: Describing, Exploring, and Comparing Data225 Questions
Exam 4: Probability219 Questions
Exam 5: Discrete Probability Distributions205 Questions
Exam 6: Normal Probability Distributions254 Questions
Exam 7: Estimating Parameters and Determining Sample Sizes170 Questions
Exam 8: Hypothesis Testing187 Questions
Exam 9: Inferences From Two Samples192 Questions
Exam 10: Correlation and Regression174 Questions
Exam 11: Goodness-Of-Fit and Contingency Tables100 Questions
Exam 12: Analysis of Variance113 Questions
Exam 13: Nonparametric Tests121 Questions
Exam 14: Statistical Process Control90 Questions
Select questions type
Examine the given run chart or control chart and determine whether the process is within statistical control. If it
is not, identity which of the three out-of-statistical-control criteria apply. A run chart for individual values W is
shown below. Does there appear to be a pattern suggesting that the process is not within statistical control? If
so, describe the pattern. 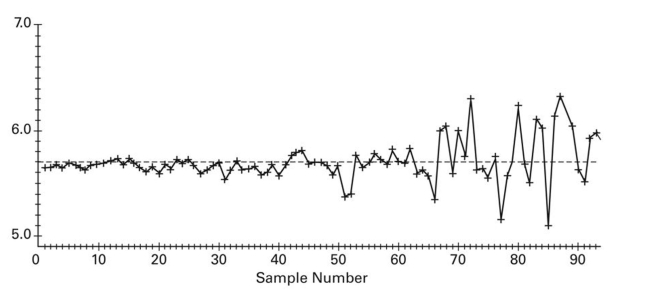
(Essay)
4.9/5  (45)
(45)
Which type of chart would be best for monitoring the proportion of items that are defective?
(Multiple Choice)
4.9/5 (46)
Match the chart with its characteristic.
The centerline is 
Correct Answer: Verified
Premises:
Responses:
The centerline is
 chart
chart (Matching)
4.8/5 (40)
Which graph using individual data values instead of a process characteristic?
(Multiple Choice)
4.9/5 (43)
A control chart for attributes is to be constructed. Which process would have wider control limits, a process
which has been having a 5% rate of nonconforming items, or a process which has been having a 10% of
nonconforming items? Assume that both processes have the same sample sizes. For a given sample size, would
it be easier to detect a shift from 5% to 10% or a shift from 10% to 15%? Explain your reasoning.
(Essay)
4.8/5 (39)
A manufacturer of lightbulbs picks 10 lightbulbs at random each day for quality control. The mean and range (in hours) of the lifetimes of the 10 lightbulbs are calculated. The results for 12 consecutive days are shown in
The table below. Construct an R chart to determine whether the process is in statistical control. Day Range 1 201.1 3.4 1.2 2 203.4 4.7 1.7 3 200.9 3.1 0.9 4 205.6 6.2 2.3 5 201.3 4.7 1.3 6 200.5 3.7 1.7 7 205.8 5.8 2.1 8 203.7 6.2 2.9 9 199.8 2.1 0.8 10 202.7 4.4 1.6 11 200.0 2.7 0.7 12 204.6 7.8 3.0 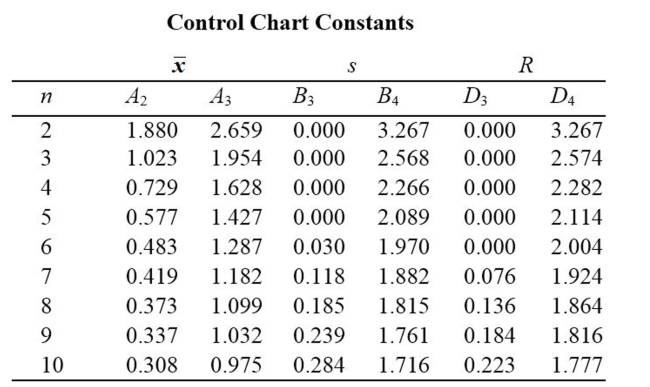
(Multiple Choice)
4.9/5 (38)
Examine the given run chart or control chart and determine whether the process is within statistical control. 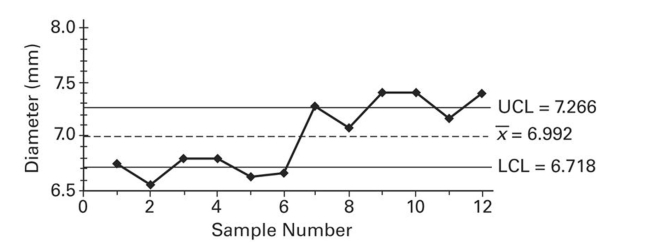
(Multiple Choice)
4.8/5 (42)
A control chart for R is shown below. Determine whether the process variation is within statistical control. If it
is not, identify which of the three out-of-control criteria lead to rejection of statistically stable variation. 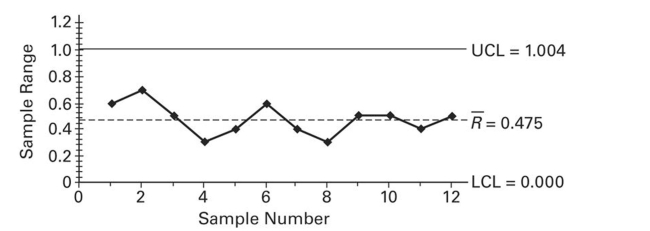
(Essay)
4.7/5 (45)
A machine that is supposed to fill small bottles to contain 20 milliliters yields the following data from a test of 4
bottles every hour. 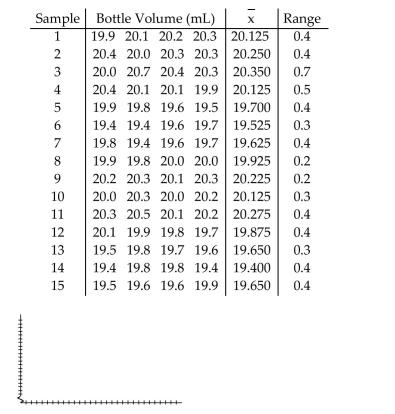
(Essay)
4.7/5 (40)
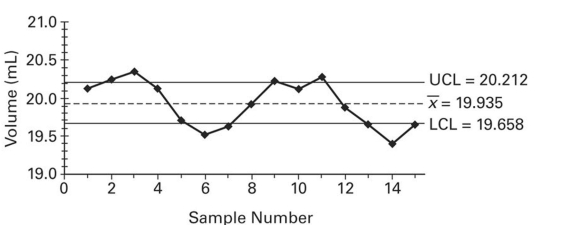
A control chart for is shown below. Determine whether the process mean is within statistical control. If it is not, identify which of the three out-of-control criteria lead to rejection of a statistically stable mean.
(Essay)
4.9/5 (37)
Describe a run chart and give an example. Refer to the values on each of the axes as you describe the run chart.
(Essay)
4.9/5 (36)
Use the given process data to construct a control chart for p. A manufacturer monitors the level of defects in the
television sets that it produces. Each week, 200 television sets are randomly selected and tested and the number of
defects is recorded. The results for 12 consecutive weeks are shown below. 4 7 5 6 8 3 12 4 4 5 6 2
(Essay)
4.9/5 (39)
A ________ is a sequential plot of individual data values over time. One axis is used for the data values, and the other axis is used for the time sequence.
(Multiple Choice)
4.8/5 (38)
Construct an R chart and determine whether the process variation is within statistical control.  A machine is supposed to fill cans that contain 12 ounces. Each hour, a sample of four cans is tested; the results of 15
consecutive hours are given below.
A machine is supposed to fill cans that contain 12 ounces. Each hour, a sample of four cans is tested; the results of 15
consecutive hours are given below. 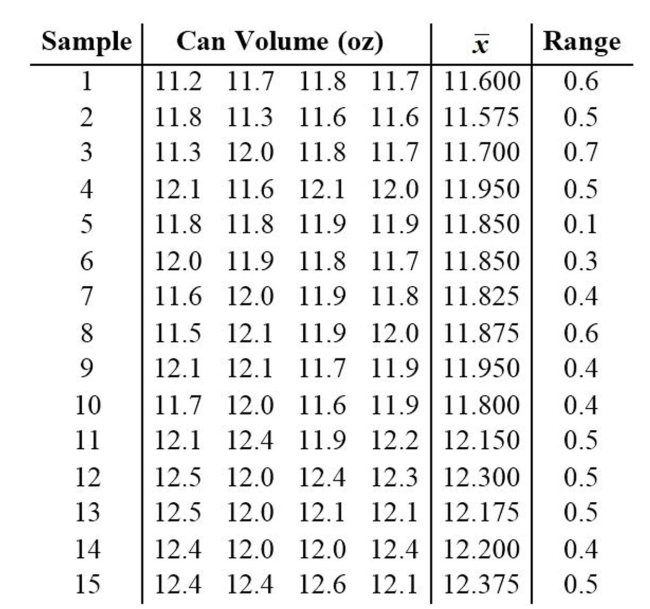
(Essay)
4.8/5 (47)
If the weight of cereal in a particular packet is less than 14 ounces, the packet is considered nonconforming.
Each week, the manufacturer randomly selects 1,000 cereal packets and determines the number that are
nonconforming. The results for 12 consecutive weeks are shown below. 46 32 21 30 47 31 32 52 48 45 62 58
(Essay)
4.9/5 (37)
Define statistically stable (or "within statistical control"). Show examples of run charts which illustrate processes
which are not statistically controlled. Discuss the pattern which indicates the process is not statistically
controlled for each example.
(Essay)
4.9/5 (40)
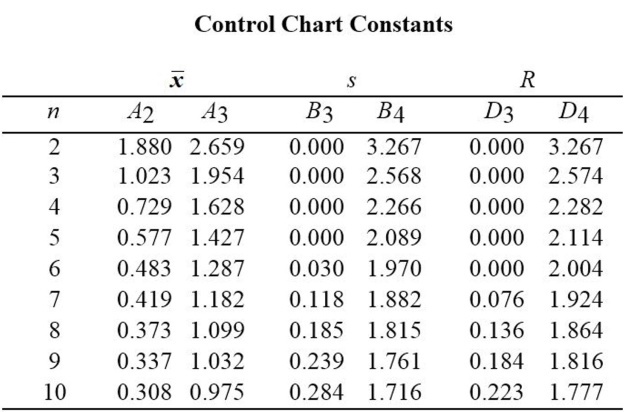 A machine is supposed to fill boxes to a weight of 50 pounds. Every 30 minutes a sample of four boxes is tested; the
results are given below.
A machine is supposed to fill boxes to a weight of 50 pounds. Every 30 minutes a sample of four boxes is tested; the
results are given below. 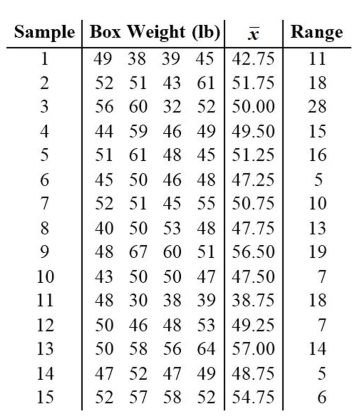
(Essay)
4.9/5 (39)
Filters
- Essay(0)
- Multiple Choice(0)
- Short Answer(0)
- True False(0)
- Matching(0)