Exam 3: Describing Data: Numerical Measures
Exam 1: What Is Statistics79 Questions
Exam 2: Describing Data: Frequencydistributions and Graphic Presentation100 Questions
Exam 3: Describing Data: Numerical Measures214 Questions
Exam 4: Describing Data: Displaying and Exploring Pata138 Questions
Exam 5: A Sulvey of Probability Concepts121 Questions
Exam 6: Discrete Probability Distributions145 Questions
Exam 7: Continuous Probabilitydistributions79 Questions
Exam 8: Sampling Methods and the Central Umit Theorem134 Questions
Exam 9: Estimation and Confidence Intervals140 Questions
Exam 10: One-Sample Tests of Hypothesis111 Questions
Exam 11: Two Sample Tests of Hypothesis103 Questions
Exam 12: Analysis of Variance173 Questions
Exam 13: Linear Regression and Correlation132 Questions
Exam 14: Multiple Regression and Correlation Analysis126 Questions
Exam 15: Chi-Square Applications94 Questions
Exam 16: Decision Making and Payoff Tables in Investment Scenarios151 Questions
Select questions type
The printout below is a summary of the average annual earnings of male full time workers in
Canada from 1999-2008. Determine the coefficient of variation. 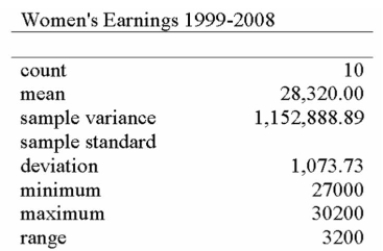
(Multiple Choice)
4.9/5  (36)
(36)
(i. If a distribution is highly skewed, the mean (measure of central tendency) should be avoided.
(ii. A characteristic of the population is called a parameter
(iii) A sample revealed that the ages of musicians playing in small local combos are 36, 29, 37, 32,
36 and 75. The median is the most appropriate measure of central tendency to represent the ages
Of the musicians.
(Multiple Choice)
4.8/5 (43)
(i. The range for laminate flooring is 0 or none.
(ii. The variance for laminate flooring is 0.
(iii) The range for nylon carpet is $0.12 or 12 cents.
(Multiple Choice)
4.8/5 (42)
i. If there is an even number of ungrouped values, then half of the values will be less than the
Median.
ii. Extremely high or low scores affect the value of the median.
iii. There are always as many values above the mean as below it.
(Multiple Choice)
4.7/5 (42)
Listed below is the box plot of average earnings ratio for full-year, full-time female workers from
1999 to 2008: 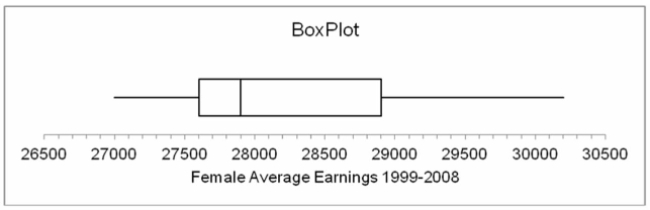 From this we can interpret that the third quartile of average earnings for women for the years 1999-
2008 was approximately:
From this we can interpret that the third quartile of average earnings for women for the years 1999-
2008 was approximately:
(Multiple Choice)
4.7/5 (31)
i. The sum of the deviations from the mean for the set of numbers 4, 9 and 5 will equal zero.
ii. If there is an even number of ungrouped values, the median is found by arranging them from low
To high and then determining the arithmetic mean of the two middle values.
iii. For salaries of $102,000, $98,000, $35,000, $106,000 and $101,000, the median would be an
Appropriate average.
(Multiple Choice)
4.8/5 (29)
(i. If two sets of data are in different units, we can compare the dispersion by using coefficient of
Variation.
(ii. A sample of the homes currently offered for sale revealed that the mean asking price is $75,900,
The median $70,100 and the modal price is $67,200. The standard deviation of the distribution is
$5,900. The Pearson's coefficient of skewness is 2.95
(iii) The coefficient of variation is a measure of central tendency.
(Multiple Choice)
4.9/5 (42)
In the calculation of the arithmetic mean for grouped data, which value is used to represent all the
Values in a particular class?
(Multiple Choice)
4.9/5 (34)
i. In a positively skewed distribution, the mean is always greater than the median.
ii. In a negatively skewed distribution, the mode occurs at the peak of the curve.
iii. In a negatively skewed distribution, the mode is greater than the median.
(Multiple Choice)
4.8/5 (39)
(i. The median for the distribution of number of sales per hour is 5 sales per hour.
(ii. The first quartile for the distribution of number of sales per hour is 4 sales per hour.
(iii) For the distribution of number of sales per hour, 50% of the observations are between 4 and 6.5.
(Multiple Choice)
4.9/5 (45)
(i. The median for the distribution of number of sales per hour is 5 sales per hour.
(ii. The first quartile for the distribution of number of sales per hour is 4 sales per hour.
(iii) For the distribution of number of sales per hour, 50% of the observations are between 3 and 7.5.
(Multiple Choice)
4.8/5 (36)
The sum of the differences between sample observations and the sample mean is
(Multiple Choice)
4.9/5 (45)
i. The mode is the value of the observation that appears most frequently.
ii. A distribution that has the same shape on either side of the center is said to be symmetrical.
iii. Negatively skewed indicates that a distribution is not symmetrical. The long tail is to the left or in
The negative direction.
(Multiple Choice)
4.7/5 (35)
(i. The research director of a large oil company conducted a study of the buying habits of
Consumers with respect to the amount of gasoline purchased at full-service pumps. The arithmetic
Mean amount is 11.5 gallons and the median amount is 11.95 litres. The standard deviation of the
Sample is 4.5 litres. The Pearson's coefficient of skewness can be calculated to be -0.30.
(ii. Rainbow Trout, Inc., feeds fingerling trout in special ponds and markets them when they attain a
Certain weight. A group of 9 trout (considered the population) were isolated in a pond and fed a
Special food mixture called Grow Em Fast. At the end of the experimental period, the weights of the
Trout were (in grams): 124, 125, 123, 120, 124, 127, 125, 126 and 121. Another special mixture, Fatso 1B,
Was used in another pond. The mean of the population was computed to be 126.9 grams and the
Standard deviation was 1.20 grams. When these data are analysed, we discover that the food
Resulting in a more uniform weight is Fatso 1B.
(iii) A study has been made of the number of hours a light bulb will operate before it burns out. If the
Variance of this distribution were computed, it would be measured in hours squared
(Multiple Choice)
4.9/5 (47)
The following printout is a summary of number of bedrooms in homes for sale in Regina: 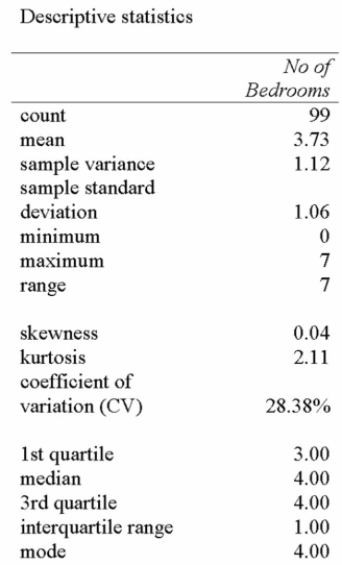 What can we determine from this printout?
(Multiple Choice)
4.8/5 (38)
A study of business faculty in Ontario revealed that the arithmetic mean annual salary is $62,000
And a standard deviation of $3,000. The study also showed that the faculty had been employed an
Average (arithmetic mean) of 15 years with a standard deviation of 4 years. How does the relative
Dispersion in the distribution of salaries compare with that of the lengths of service?
(Multiple Choice)
4.9/5 (24)
(i. If a distribution is highly skewed, the median (measure of central tendency) should be avoided.
(ii. A characteristic of the population is called a parameter
(iii) A sample revealed that the ages of musicians playing in small local combos are 36, 29, 37, 32,
36 and 75. The median is the most appropriate measure of central tendency to represent the ages
Of the musicians.
(Multiple Choice)
4.7/5 (48)
(i. The range for laminate flooring is 0 or none.
(ii. The variance for laminate flooring is 1.
(iii) The range for nylon carpet is $0.12 or 12 cents.
(Multiple Choice)
4.8/5 (37)
The mean, as a measure of central location would be inappropriate for which one of the following?
(Multiple Choice)
4.9/5 (30)
Filters
- Essay(0)
- Multiple Choice(0)
- Short Answer(0)
- True False(0)
- Matching(0)