Exam 3: Describing Data: Numerical Measures
Exam 1: What Is Statistics79 Questions
Exam 2: Describing Data: Frequencydistributions and Graphic Presentation100 Questions
Exam 3: Describing Data: Numerical Measures214 Questions
Exam 4: Describing Data: Displaying and Exploring Pata138 Questions
Exam 5: A Sulvey of Probability Concepts121 Questions
Exam 6: Discrete Probability Distributions145 Questions
Exam 7: Continuous Probabilitydistributions79 Questions
Exam 8: Sampling Methods and the Central Umit Theorem134 Questions
Exam 9: Estimation and Confidence Intervals140 Questions
Exam 10: One-Sample Tests of Hypothesis111 Questions
Exam 11: Two Sample Tests of Hypothesis103 Questions
Exam 12: Analysis of Variance173 Questions
Exam 13: Linear Regression and Correlation132 Questions
Exam 14: Multiple Regression and Correlation Analysis126 Questions
Exam 15: Chi-Square Applications94 Questions
Exam 16: Decision Making and Payoff Tables in Investment Scenarios151 Questions
Select questions type
A sample of light trucks using diesel fuel revealed the following distribution based on fuel efficiency,
i.e., litres per 100 km. 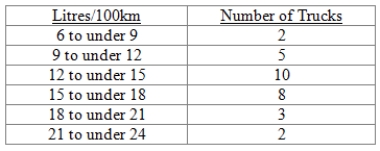 What is the arithmetic mean in litres per 100 km?
(Multiple Choice)
4.7/5  (41)
(41)
(i. The standard deviation for laminate flooring is 0.
(ii. The standard deviation for polyester carpet is $1.48.
(iii) The range for polyester carpet is $1.04.
(Multiple Choice)
4.8/5 (37)
The mean, as a measure of central tendency, would be inappropriate for which one of the
Following?
(Multiple Choice)
4.7/5 (43)
The coefficient of variation for a set of annual incomes is 18%; the coefficient of variation for the
Length of service with the company is 29%. What does this indicate?
(Multiple Choice)
4.8/5 (36)
(i. The research director of a large oil company conducted a study of the buying habits of
Consumers with respect to the amount of gasoline purchased at full-service pumps. The arithmetic
Mean amount is 11.5 gallons and the median amount is 11.95 litres. The standard deviation of the
Sample is 4.5 litres. The Pearson's coefficient of skewness can be calculated to be + 0.30.
(ii. Rainbow Trout, Inc., feeds fingerling trout in special ponds and markets them when they attain a
Certain weight. A group of 9 trout (considered the population) were isolated in a pond and fed a
Special food mixture called Grow Em Fast. At the end of the experimental period, the weights of the
Trout were (in grams): 124, 125, 123, 120, 124, 127, 125, 126 and 121. Another special mixture, Fatso 1B,
Was used in another pond. The mean of the population was computed to be 126.9 grams and the
Standard deviation was 1.20 grams. When these data are analysed, we discover that the food
Resulting in a more uniform weight is Fatso 1B.
(iii) A study has been made of the number of hours a light bulb will operate before it burns out. If the
Variance of this distribution were computed, it would be measured in hours squared
(Multiple Choice)
4.9/5 (37)
i. In a positively skewed distribution, the mean is always greater than the median.
ii. In a negatively skewed distribution, the median occurs at the peak of the curve.
iii. In a negatively skewed distribution, the mode is greater than the median.
(Multiple Choice)
4.8/5 (34)
The information below shows the summary statistics of data adapted from Statistics Canada,
Regarding gasoline prices from urban cities across Canada. 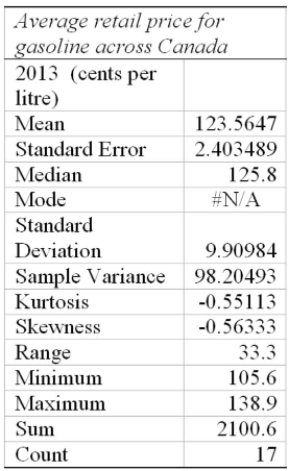 (i. This data is based on values from 17 cities.
(ii. The average gas price in 2013 across the country based on this sample was $123.56
(iii) More than 50% of the cities reported average gas prices over $1.25 per litre
(i. This data is based on values from 17 cities.
(ii. The average gas price in 2013 across the country based on this sample was $123.56
(iii) More than 50% of the cities reported average gas prices over $1.25 per litre
(Multiple Choice)
4.8/5 (42)
(i. Based on the values of the arithmetic mean, median, and mode, the distribution is most likely
Symmetrical.
(ii. The arithmetic mean is 20.4.
(iii) The median is 21.
(Multiple Choice)
4.8/5 (32)
The lengths of stay on the cancer floor of Community Hospital were organized into a frequency
Distribution. The mean length was 28 days, the median 25 days and the modal length 23 days. The
Standard deviation was computed to be 4.2 days. Determine the Pearson's coefficient of skewness.
(Multiple Choice)
4.7/5 (45)
i. The interquartile range is the average of the values of the first and third quartile.
ii. An outlier is a data point that always occurs in the first quartile.
iii. A student scored in the 85 percentile on a standardized test. This means that the student scored
Lower than 85% of the rest of the students taking the test.
(Multiple Choice)
4.9/5 (37)
AAA Heating and Air Conditioning completed 30 jobs last month with a mean revenue of $5,430
Per job. The president wants to know the total revenue for the month.
(Multiple Choice)
4.9/5 (32)
(i. The arithmetic mean (measure of central tendency) cannot be determined if the distribution has
An open-ended class.
(ii. The measure of central tendency used to determine the average annual percent increase in
Sales from one time period to another is the geometric mean.
(iii) The smallest measure of central tendency in a positively skewed distribution is the mode.
(Multiple Choice)
4.7/5 (39)
Listed below is the box plot of average earnings ratio for full-year, full-time female workers from
1999 to 2008.  From this we can interpret that the distribution of average earnings for women for the years 1999-
2008 was:
From this we can interpret that the distribution of average earnings for women for the years 1999-
2008 was:
(Multiple Choice)
4.9/5 (36)
The weights (in grams) of the contents of several small bottles are 4, 2, 5, 4, 5, 2 and 6. What is the
Sample variance?
(Multiple Choice)
4.9/5 (33)
(i. If two sets of data are in different units, we can compare the dispersion by using coefficient of
Skewness.
(ii. A sample of the homes currently offered for sale revealed that the mean asking price is $75,900,
The median $70,100 and the modal price is $67,200. The standard deviation of the distribution is
$5,900. The Pearson's coefficient of skewness is 2.95
(iii) The coefficient of variation is a measure of relative dispersion.
(Multiple Choice)
5.0/5 (35)
(i. If two sets of data are in different units, we can compare the dispersion by using coefficient of
Variation.
(ii. A study is made of the commissions paid to furniture salespersons. If the variance is computed, it
Would be measured in dollars squared.
(iii) The coefficient of skewness is a measure of relative dispersion.
(Multiple Choice)
4.8/5 (32)
The ages of a sample of telephones used in a small town hotel were organized into the following
Table: 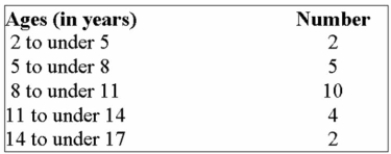 What is the sample variance?
(Multiple Choice)
4.9/5 (39)
Referring to the histogram below, choose the best term to describe its shape. 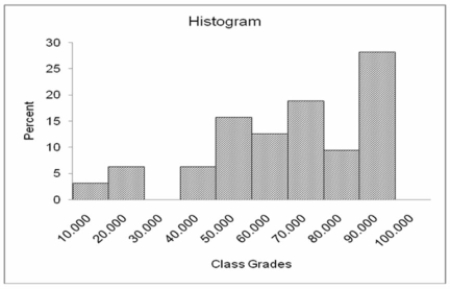
(Multiple Choice)
4.8/5 (40)
A large oil company is studying the number of gallons of gasoline purchased per customer at self-
Service pumps. The mean number of litres is 10.0 with a standard deviation of 3.0 litres. The median
Is 10.75 litres. What is the Pearson's coefficient of skewness?
(Multiple Choice)
4.7/5 (29)
Referring to the printout below, describe the shape of the distribution of the corresponding
Histogram. 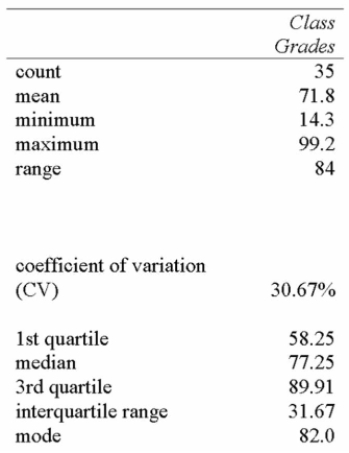
(Multiple Choice)
4.9/5 (34)
Filters
- Essay(0)
- Multiple Choice(0)
- Short Answer(0)
- True False(0)
- Matching(0)