Exam 2: Describing Data: Frequencydistributions and Graphic Presentation
Exam 1: What Is Statistics79 Questions
Exam 2: Describing Data: Frequencydistributions and Graphic Presentation100 Questions
Exam 3: Describing Data: Numerical Measures214 Questions
Exam 4: Describing Data: Displaying and Exploring Pata138 Questions
Exam 5: A Sulvey of Probability Concepts121 Questions
Exam 6: Discrete Probability Distributions145 Questions
Exam 7: Continuous Probabilitydistributions79 Questions
Exam 8: Sampling Methods and the Central Umit Theorem134 Questions
Exam 9: Estimation and Confidence Intervals140 Questions
Exam 10: One-Sample Tests of Hypothesis111 Questions
Exam 11: Two Sample Tests of Hypothesis103 Questions
Exam 12: Analysis of Variance173 Questions
Exam 13: Linear Regression and Correlation132 Questions
Exam 14: Multiple Regression and Correlation Analysis126 Questions
Exam 15: Chi-Square Applications94 Questions
Exam 16: Decision Making and Payoff Tables in Investment Scenarios151 Questions
Select questions type
(i. For a stem-and-leaf display, the leaf for the value 98 is 9.
(ii. There is some loss of information when raw data is tallied into a stem-and-leaf display.
(iii) A cumulative frequency distribution is used when we want to determine how many observations
Lie above or below certain values.
(Multiple Choice)
4.7/5  (29)
(29)
The following ages (rounded to the nearest whole year) of employees at a large company that were
Grouped into a distribution with class limits:
20 up to 30
30 up to 40
40 up to 50
50 up to 60
60 up to 70
(i. The class limits for the class 50 up to 60 class are 50 and60.
(ii. The midpoint for the class 40 up to 50 is 45.
(iii) The class interval is 10.
(Multiple Choice)
4.9/5 (33)
Refer to the following price of jeans are recorded to the nearest dollar:
The first two class midpoints are $62.50 and $65.50.
What are the class limits for the third class?
(Multiple Choice)
4.9/5 (28)
A useful chart or graph to use for illustrating relative frequencies is the ________________?
(Multiple Choice)
4.8/5 (41)
What is the relative class frequency for the $25 up to $35 class? 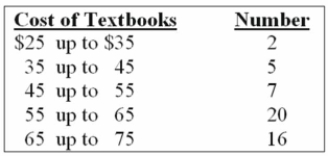
(Multiple Choice)
4.9/5 (34)
The grades on a statistics exam for a sample of students are as follows: 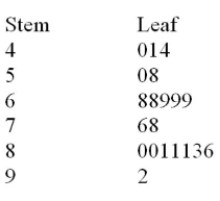 If A + = 90%-100%
A = 80%-89%
B+ = 75%-79%
B = 70%-74%
C+ = 65%-69%
C = 60%-64%
D+ = 55%-59%
D= 50%-54%
F=0-49%
What is the most common letter grade earned?
If A + = 90%-100%
A = 80%-89%
B+ = 75%-79%
B = 70%-74%
C+ = 65%-69%
C = 60%-64%
D+ = 55%-59%
D= 50%-54%
F=0-49%
What is the most common letter grade earned?
(Multiple Choice)
4.8/5 (33)
(i. A frequency distribution is grouping of data into classes showing the number of observations in
Each class.
(ii. In constructing a frequency distribution, you should try to have open-ended classes such as
"Under $100" and "$1,000 and over".
(iii) A cumulative frequency distribution is used when we want to determine how many observations
Lie above or below certain values.
(Multiple Choice)
4.7/5 (33)
What are the class limits for the class with the smallest number of frequencies?
(Multiple Choice)
4.8/5 (29)
If the enrolment for this Faculty of Business remained constant at 625 between 2000 and 2001,
Determine the change in the enrolment in the School of Accounting during this time. 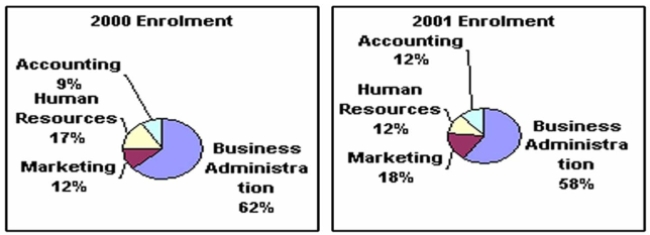
(Multiple Choice)
4.9/5 (31)
Monthly commissions of first-year insurance brokers are $1,270, $1,310, $1,680, $1,380, $1,410,
$1,570, $1,180 and $1,420. These figures are referred to as:
(Multiple Choice)
4.8/5 (33)
(i. Pie charts are useful for showing the percent that various components compose of the total.
(ii. Simple bar charts may be constructed either horizontally or vertically.
(iii) A Frequency Polygon is ideal for showing the trend or sales of income over time.
(Multiple Choice)
4.9/5 (33)
The following class intervals for a frequency distribution were developed to provide information
Regarding the starting salaries for students graduating from a particular school: 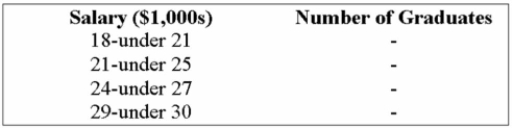 Before data was collected, someone questioned the validity of this arrangement. Which of the
Following represents a problem with this set of intervals?
Before data was collected, someone questioned the validity of this arrangement. Which of the
Following represents a problem with this set of intervals?
(Multiple Choice)
4.8/5 (31)
The head of the statistics department wants to determine the number of mistake made by students
In their first online assignment. She gathers information from her classes of the past year. 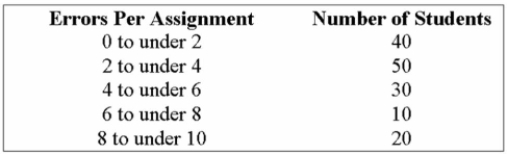 The approximate range (distance from the minimum value in the raw data up to the maximum value)
Of the data is _________.
The approximate range (distance from the minimum value in the raw data up to the maximum value)
Of the data is _________.
(Multiple Choice)
4.8/5 (34)
Consider the following relative frequency distribution: 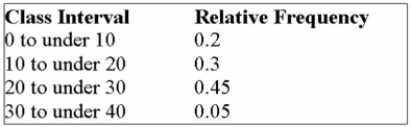 If there are 2,000 numbers in the data set, how many of the values are less than 30?
(Multiple Choice)
4.8/5 (39)
A row of a stem-and-leaf chart appears as follows: 3 | 0 1 3 5 7 9. Assume that the data is rounded to
The nearest unit.
(Multiple Choice)
4.9/5 (36)
The Lake Ontario Credit Union selected a sample of 40 student chequing accounts. Below is a chart
Of their end-of-the-month balances. The bank considers any student with an ending balance of
$400 or more a "preferred customer". Estimate the number of preferred customers in this sample. 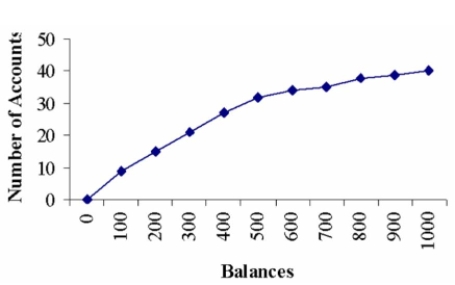
(Multiple Choice)
4.9/5 (38)
Filters
- Essay(0)
- Multiple Choice(0)
- Short Answer(0)
- True False(0)
- Matching(0)