Exam 2: Describing Data: Frequencydistributions and Graphic Presentation
Exam 1: What Is Statistics79 Questions
Exam 2: Describing Data: Frequencydistributions and Graphic Presentation100 Questions
Exam 3: Describing Data: Numerical Measures214 Questions
Exam 4: Describing Data: Displaying and Exploring Pata138 Questions
Exam 5: A Sulvey of Probability Concepts121 Questions
Exam 6: Discrete Probability Distributions145 Questions
Exam 7: Continuous Probabilitydistributions79 Questions
Exam 8: Sampling Methods and the Central Umit Theorem134 Questions
Exam 9: Estimation and Confidence Intervals140 Questions
Exam 10: One-Sample Tests of Hypothesis111 Questions
Exam 11: Two Sample Tests of Hypothesis103 Questions
Exam 12: Analysis of Variance173 Questions
Exam 13: Linear Regression and Correlation132 Questions
Exam 14: Multiple Regression and Correlation Analysis126 Questions
Exam 15: Chi-Square Applications94 Questions
Exam 16: Decision Making and Payoff Tables in Investment Scenarios151 Questions
Select questions type
Quinn's Café serves ice cream. She asks 100 of her regular customers to take a taste test and pick
The flavour they like the best. The results are shown in the following table. 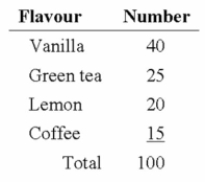 Is the data quantitative or qualitative? What is the name of the table shown?
(Multiple Choice)
4.9/5  (32)
(32)
A group of 100 students were surveyed about their interest in a new International Studies program.
The survey asked students about their interest in the program in terms of high, medium, or low. 30
Students responded high interest; 50 students responded medium interest; 20 students responded
Low interest. What is the relative frequency of students with low interest?
(Multiple Choice)
4.8/5 (36)
The grades on a statistics exam for a sample of students are as follows: 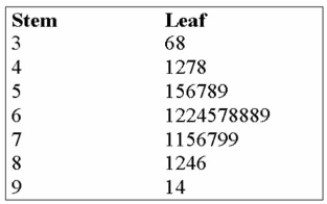 If A + = 90%-100%
A = 80%-89%
B+ = 75%-79%
B = 70%-74%
C+ = 65%-69%
C = 60%-64%
D = 55%-59%
F = 0%-54%
How many student earned a letter grade of C?
If A + = 90%-100%
A = 80%-89%
B+ = 75%-79%
B = 70%-74%
C+ = 65%-69%
C = 60%-64%
D = 55%-59%
F = 0%-54%
How many student earned a letter grade of C?
(Multiple Choice)
4.7/5 (33)
When data is collected using a qualitative, nominal variable, i.e., male or female, what is true about a
Frequency distribution that summarizes the data?
(Multiple Choice)
4.8/5 (36)
(i. A frequency table is a grouping of qualitative data into mutually exclusive classes showing the
Number of observations in each class.
(ii. Simple bar charts may be constructed either horizontally or vertically.
(iii) A bar chart is a graphic representation of a frequency table.
(Multiple Choice)
4.9/5 (38)
The grades on a statistics exam for a sample of students are as follows: 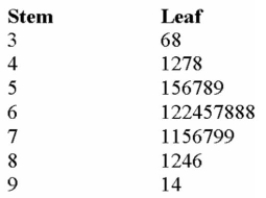 If A + = 90%-100%
A = 80%-89%
B+ = 75%-79%
B = 70%-74%
C+ = 65%-69%
C = 60%-64%
D+ = 55%-59%
D= 50%-54%
F=0-49%
What is the most common letter grade earned?
If A + = 90%-100%
A = 80%-89%
B+ = 75%-79%
B = 70%-74%
C+ = 65%-69%
C = 60%-64%
D+ = 55%-59%
D= 50%-54%
F=0-49%
What is the most common letter grade earned?
(Multiple Choice)
4.8/5 (40)
What percentage of the firms export less than $14 million in product?
(Multiple Choice)
4.8/5 (38)
The chart below shows the Gross Domestic Product for 7 nations. Which of the following statements
Can be determined from this chart? 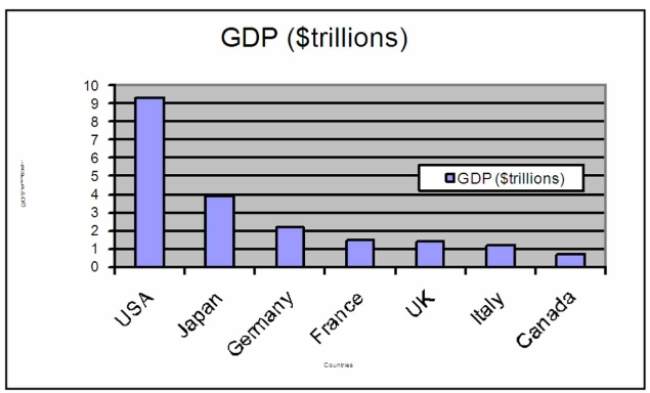
(Multiple Choice)
4.9/5 (33)
Which is the best (most informative and useful) graphical display of the Average Weekly Earnings
Health Care in Canada over the years 2008 to 2012?
(Multiple Choice)
4.8/5 (41)
(i. A table showing the number of observations that have been grouped into each of several classes
Is called a frequency distribution.
(ii. When classes in a frequency table are constructed so that data will fit into only one category, it is
Called mutually exclusive.
(iii) The best means to display data that is based on a trend over a period of time is the polygon.
(Multiple Choice)
4.7/5 (33)
Why are unequal class intervals sometimes used in a frequency distribution?
(Multiple Choice)
4.8/5 (33)
The grades on a statistics exam for a sample of students are as follows: 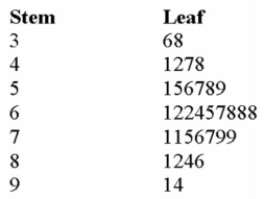 If A = 80%-100%
B = 70%-79%
C = 60%-69%
D= 50%-59%
F=0-49%
What is the most common letter grade earned?
If A = 80%-100%
B = 70%-79%
C = 60%-69%
D= 50%-59%
F=0-49%
What is the most common letter grade earned?
(Multiple Choice)
4.9/5 (35)
(i. A table showing the number of observations that have been grouped into each of several classes
Is called a frequency distribution.
(ii. When classes in a frequency table are constructed so that data will fit into only one category, it is
Called a relative class frequency.
(iii) The suggested class interval based on number of observations given the data ranges from 100
To 200 with 50 observations is 50.
(Multiple Choice)
4.8/5 (39)
The following ages (rounded to the nearest whole year) of employees at a large company that were
Grouped into a distribution with class limits:
20 up to 30
30 up to 40
40 up to 50
50 up to 60
60 up to 70
(i. The class limits for the class 50 up to 60 class are 50 and 58.
(ii. The midpoint for the class 40 up to 50 is 45.
(iii) The class interval is 9.
(Multiple Choice)
4.9/5 (33)
A sample distribution of hourly earnings in Paul's Cookie Factory is: 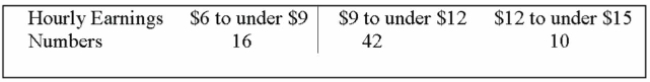 The limits of the class with the smallest frequency are:
(Multiple Choice)
4.9/5 (42)
What is the class midpoint for the class with the greatest frequency?
(Multiple Choice)
4.9/5 (34)
Filters
- Essay(0)
- Multiple Choice(0)
- Short Answer(0)
- True False(0)
- Matching(0)