Exam 2: Describing Data: Frequencydistributions and Graphic Presentation
Exam 1: What Is Statistics79 Questions
Exam 2: Describing Data: Frequencydistributions and Graphic Presentation100 Questions
Exam 3: Describing Data: Numerical Measures214 Questions
Exam 4: Describing Data: Displaying and Exploring Pata138 Questions
Exam 5: A Sulvey of Probability Concepts121 Questions
Exam 6: Discrete Probability Distributions145 Questions
Exam 7: Continuous Probabilitydistributions79 Questions
Exam 8: Sampling Methods and the Central Umit Theorem134 Questions
Exam 9: Estimation and Confidence Intervals140 Questions
Exam 10: One-Sample Tests of Hypothesis111 Questions
Exam 11: Two Sample Tests of Hypothesis103 Questions
Exam 12: Analysis of Variance173 Questions
Exam 13: Linear Regression and Correlation132 Questions
Exam 14: Multiple Regression and Correlation Analysis126 Questions
Exam 15: Chi-Square Applications94 Questions
Exam 16: Decision Making and Payoff Tables in Investment Scenarios151 Questions
Select questions type
A group of 100 students were surveyed about their interest in a new International Studies program.
The survey asked students about their interest in the program in terms of high, medium, or low. 30
Students responded high interest; 50 students responded medium interest; 20 students responded
Low interest. What is the relative frequency of students with medium interest?
(Multiple Choice)
4.8/5  (35)
(35)
(i. Pie charts are useful for showing the percent that various components compose of the total.
(ii. Simple bar charts may be constructed either horizontally or vertically.
(iii) A bar chart is a graphic representation of a frequency table.
(Multiple Choice)
4.9/5 (34)
(i. If you are constructing a stem-and-leaf display, the "20" in 20.5 would be the stem.
(ii. An advantage of a stem-and-leaf chart over a histogram is that the identity of each observation is
Not lost, and that it presents a picture of the distribution.
(iii) If you are constructing a stem-and-leaf display, the "20" in 20.5 would be the leaf.
(Multiple Choice)
4.9/5 (41)
(i. A frequency table is a grouping of qualitative data into mutually exclusive classes showing the
Number of observations in each class.
(ii. Simple bar charts may be constructed either horizontally or vertically.
(iii) A relative frequency table shows the fraction or percent of the number of observations in each
Class.
(Multiple Choice)
4.8/5 (32)
(i. In constructing a frequency distribution, you should try to have open-ended classes such as
"Under $100" and "$1,000 and over".
(ii. To convert a frequency distribution to a relative frequency distribution, divide each class
Frequency by the sum of the class frequencies.
(iii) When constructing a frequency distribution, try to include overlapping stated class limits, such as
100 up to 201, 200 up to 301, and 300 up to 401.
(Multiple Choice)
4.9/5 (43)
A student was studying the political party preferences of a university's student population. The
Survey instrument asked students to identify themselves as a Conservative or NDP. This question is
flawed because:
(Multiple Choice)
4.9/5 (35)
(i. If you are constructing a stem-and-leaf display, the "20" in 20.5 would be the stem.
(ii. An advantage of a stem-and-leaf chart over a histogram is that the identity of each observation is
Not lost, and that it presents a picture of the distribution.
(iii) An advantage of a stem-and-leaf chart over a histogram is that it presents a picture of the
Distribution.
(Multiple Choice)
4.7/5 (42)
What is the relative frequency for those salespersons that earn between $1,600 and $1,799?
(Multiple Choice)
4.8/5 (25)
The monthly salaries of a sample of 100 employees were rounded to the nearest ten dollars. They
Ranged from a low of $1,040 to a high of $1,720. If we want to condense the data into seven classes,
What is the most convenient class interval?
(Multiple Choice)
4.8/5 (33)
(i.. The stem in a stem-and-leaf display is the leading digit
(ii. There is no loss of information when raw data is tallied into a stem-and-leaf display.
(iii). For a stem-and-leaf display, the leaf for the value 98 is 9
(Multiple Choice)
4.8/5 (42)
The grades on a statistics exam for a sample of students are as follows: 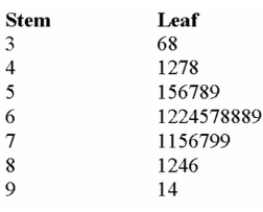 How many students wrote this test?
(Multiple Choice)
4.9/5 (46)
Using the frequency table below, determine the relative frequencies for Apartment and Townhouse
Listings. 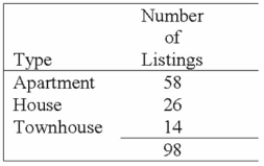
(Multiple Choice)
4.7/5 (42)
What is the relative frequency for those salespersons that earn between $1,500 and $1,800?
(Multiple Choice)
4.7/5 (24)
In a frequency distribution, what is the number of observations in a class called?
(Multiple Choice)
4.7/5 (38)
Given the following stem and leaf plot, determine the smallest value in the data set. 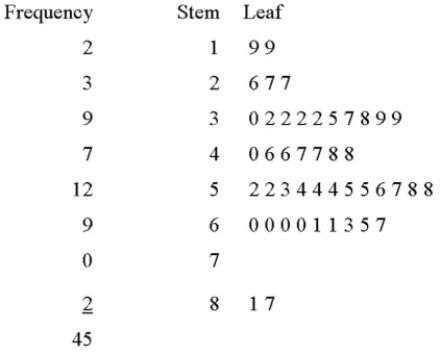
(Multiple Choice)
4.8/5 (43)
The following represent the ages of students in a class:
19, 23, 21, 19, 19, 20, 22, 31, 21, 20
If a stem and leaf plot were to be developed from this, how many stems would there be?
(Multiple Choice)
4.7/5 (39)
Filters
- Essay(0)
- Multiple Choice(0)
- Short Answer(0)
- True False(0)
- Matching(0)