Exam 11: Two Sample Tests of Hypothesis
Exam 1: What Is Statistics79 Questions
Exam 2: Describing Data: Frequencydistributions and Graphic Presentation100 Questions
Exam 3: Describing Data: Numerical Measures214 Questions
Exam 4: Describing Data: Displaying and Exploring Pata138 Questions
Exam 5: A Sulvey of Probability Concepts121 Questions
Exam 6: Discrete Probability Distributions145 Questions
Exam 7: Continuous Probabilitydistributions79 Questions
Exam 8: Sampling Methods and the Central Umit Theorem134 Questions
Exam 9: Estimation and Confidence Intervals140 Questions
Exam 10: One-Sample Tests of Hypothesis111 Questions
Exam 11: Two Sample Tests of Hypothesis103 Questions
Exam 12: Analysis of Variance173 Questions
Exam 13: Linear Regression and Correlation132 Questions
Exam 14: Multiple Regression and Correlation Analysis126 Questions
Exam 15: Chi-Square Applications94 Questions
Exam 16: Decision Making and Payoff Tables in Investment Scenarios151 Questions
Select questions type
i. The rejection region for analysis of variance is in the upper tail of the F distribution.
ii. In ANOVA, k -1 degrees of freedom are associated with the numerator of the F ratio.
iii. In ANOVA, k-1 degrees of freedom are associated with the denominator of the F ratio.
(Multiple Choice)
4.8/5  (38)
(38)
i. One characteristic of the F distribution is that F cannot be negative.
ii. The shape of the F distribution is determined by the degrees of freedom for the F-statistic, one for
The numerator and one for the denominator.
iii. The F distribution's curve is positively skewed.
(Multiple Choice)
4.9/5 (33)
i. One characteristic of the F distribution is that F cannot be negative.
ii. One characteristic of the F distribution is that computed F can only range between -1 and +1.
iii. The shape of the F distribution is positively skewed.
(Multiple Choice)
4.9/5 (32)
Suppose we select 20 observations from each of five treatments. The appropriate degrees of
Freedom are:
(Multiple Choice)
4.7/5 (33)
i. To employ ANOVA, the populations being studied must be approximately normally distributed.
ii. A technique that is efficient when simultaneously comparing more than two population means is
Known as analysis of variance (ANOVA).
iii. The least number of sources of variation in ANOVA is two.
(Multiple Choice)
4.8/5 (33)
i. The test statistic used in ANOVA is t.
ii. The calculated F value must be equal to or greater than one (1).
iii. The shape of the F distribution is symmetrical.
(Multiple Choice)
4.8/5 (39)
The annual dividend rates for a random sample of 16 companies in three different industries,
Utilities, banking, and insurance were recorded. The ANOVA comparing the mean annual dividend
Rate among three industries rejected the null hypothesis that the dividend rates were equal. The
Mean Square Error (MSE) was 3.36. The following table summarized the results: ![The annual dividend rates for a random sample of 16 companies in three different industries, Utilities, banking, and insurance were recorded. The ANOVA comparing the mean annual dividend Rate among three industries rejected the null hypothesis that the dividend rates were equal. The Mean Square Error (MSE) was 3.36. The following table summarized the results: The interval is [3.38, 8.18]. Based on the comparison between the mean annual dividend rate for Companies in the utilities and insurance industries, _______________________.](https://storage.examlex.com/TB1024/11eb5577_4337_2ac9_a086_1beb48a054e1_TB1024_00.jpg) The interval is [3.38, 8.18]. Based on the comparison between the mean annual dividend rate for
Companies in the utilities and insurance industries, _______________________.
The interval is [3.38, 8.18]. Based on the comparison between the mean annual dividend rate for
Companies in the utilities and insurance industries, _______________________.
(Multiple Choice)
4.7/5 (39)
Given the following Analysis of Variance table for three treatments each with six observations. 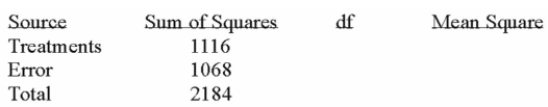 What is the decision?
(Multiple Choice)
4.8/5 (37)
i. The F distribution is positively skewed and its values may range from 0 to plus infinity.
ii. The F distribution's curve is positively symmetrical.
iii. Like Student's t distribution, a change in the degrees of freedom causes a change in the shape of
The F distribution.
(Multiple Choice)
4.7/5 (36)
The plant manager believes that the temperature in the packaging area of the plant affects the daily
Rate of production. To investigate, the plant temperature is set at 18 degrees, 20 degrees, and 22
Degrees. The number of units produced at each of these temperatures for a sample of days is
Collected. 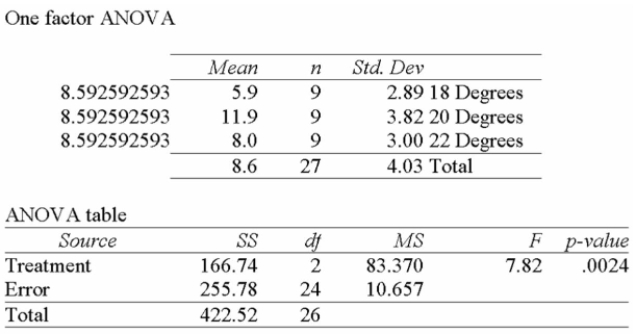 Using this output, what conclusions can you draw?
(Multiple Choice)
4.9/5 (27)
Suppose that an automobile manufacturer designed a radically new lightweight engine and wants
To recommend the grade of gasoline to use. The four grades are: below regular, regular, premium,
And super premium. The test car made three trial runs on the test track using each of the four
Grades. Assuming any grade can be used at the 0.05 level, what is the critical value of F using 0.05
Level of significance? 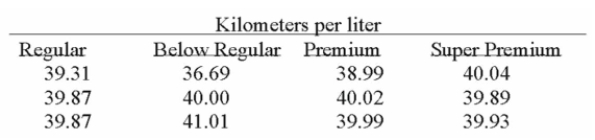
(Multiple Choice)
4.8/5 (36)
Which of the following is NOT a characteristic of the F distribution?
(Multiple Choice)
4.9/5 (36)
Using the Excel printout below to compare the mean annual incomes for executives with
Undergraduate and Master's Degree or more, the following statements can be made: 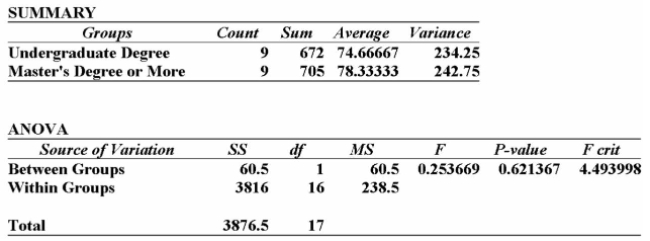
(Multiple Choice)
4.8/5 (31)
Given the following Analysis of Variance table for three treatments each with six observations. 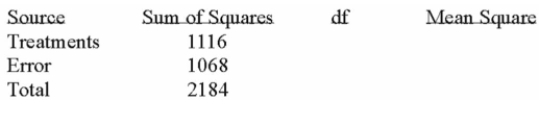 What is the computed value of F?
(Multiple Choice)
4.8/5 (29)
i. If we want to determine which treatment means differ, one method is confidence intervals.
ii. If the confidence interval includes 0, there is no difference in the pair of treatment means.
iii. If both end points of a confidence interval are of the same sign, it indicates that the treatment
Means are not different.
(Multiple Choice)
4.9/5 (39)
Suppose that an automobile manufacturer designed a radically new lightweight engine and wants
To recommend the grade of gasoline to use. The four grades are: below regular, regular, premium,
And super premium. The test car made three trial runs on the test track using each of the four
Grades. Is there a difference in the performance between the four grades of gas? 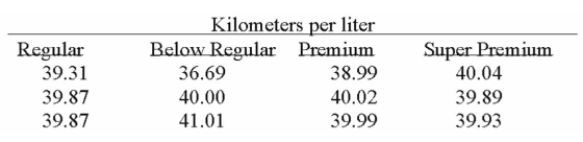 If you were to use Excel to assist in your solution to this problem, which test would you use?
(Multiple Choice)
4.9/5 (27)
Two accounting professors decided to compare the variation of their grading procedures. To
Accomplish this they each graded the same 10 exams with the following results: 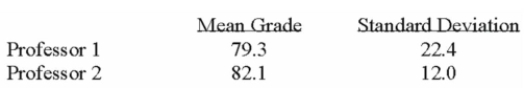 What are the degrees of freedom for the denominator of the F ratio?
(Multiple Choice)
4.8/5 (37)
The annual dividend rates for a random sample of 16 companies in three different industries,
Utilities, banking, and insurance were recorded. The ANOVA comparing the mean annual dividend
Rate among three industries rejected the null hypothesis that the dividend rates were equal. The
Mean Square Error (MSE) was 3.36. The following table summarized the results: 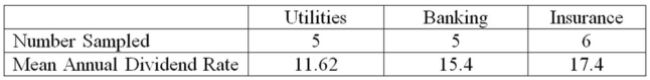 Compare the mean annual dividend rate for companies in the utilities and insurance industries and
Construct the 95% confidence interval.
Compare the mean annual dividend rate for companies in the utilities and insurance industries and
Construct the 95% confidence interval.
(Multiple Choice)
5.0/5 (34)
Filters
- Essay(0)
- Multiple Choice(0)
- Short Answer(0)
- True False(0)
- Matching(0)