Exam 2: Organizing and Visualizing Data
Exam 1: Introduction145 Questions
Exam 2: Organizing and Visualizing Data210 Questions
Exam 3: Numerical Descriptive Measures153 Questions
Exam 4: Basic Probability171 Questions
Exam 5: Discrete Probability Distributions218 Questions
Exam 6: The Normal Distribution and Other Continuous Distributions191 Questions
Exam 7: Sampling and Sampling Distributions197 Questions
Exam 8: Confidence Interval Estimation196 Questions
Exam 9: Fundamentals of Hypothesis Testing: One-Sample Tests165 Questions
Exam 10: Two-Sample Tests210 Questions
Exam 11: Analysis of Variance213 Questions
Exam 12: Chi-Square Tests and Nonparametric Tests201 Questions
Exam 13: Simple Linear Regression213 Questions
Exam 14: Introduction to Multiple Regression355 Questions
Exam 15: Multiple Regression Model Building96 Questions
Exam 16: Time-Series Forecasting168 Questions
Exam 17: Statistical Applications in Quality Management133 Questions
Exam 18: A Roadmap for Analyzing Data54 Questions
Exam 19: Questions that Involve Online Topics321 Questions
Select questions type
TABLE 2-12
The table below contains the opinions of a sample of 200 people broken down by gender about the latest congressional plan to eliminate anti-trust exemptions for professional baseball. 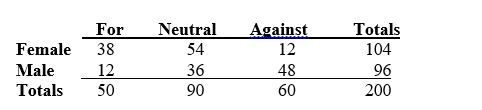 -Referring to Table 2-12, if the sample is a good representation of the population, we can expect ________ percent of the males in the population will be against the plan.
(Short Answer)
4.8/5  (29)
(29)
When studying the simultaneous responses to two categorical questions, you should set up a
(Multiple Choice)
4.8/5 (36)
Apple Computer, Inc. collected information on the age of their customers. The youngest customer was 12 and the oldest was 72. To study the distribution of the age among its customers, it can use a percentage polygon.
(True/False)
4.8/5 (38)
Tim was planning for a meeting with his boss to discuss a raise in his annual salary. In preparation, he wanted to use the Consumer Price Index to determine the percentage increase in his real (inflation-adjusted) salary over the last three years. Which of the 4 methods of data collection was involved when he used the Consumer Price Index?
(Multiple Choice)
5.0/5 (43)
Relationships in a contingency table can be examined more fully if the frequencies are converted into ________.
(Short Answer)
4.8/5 (38)
Data on the number of part-time hours students at a public university worked in a week were collected. Which of the following is the best chart for presenting the information?
(Multiple Choice)
4.7/5 (33)
TABLE 2-17
The following table presents total retail sales in millions of dollars for the leading apparel companies during April 2009 and April 2010.
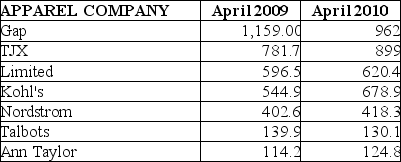 -Referring to Table 2-17, construct a side-by-side bar chart.
(Essay)
4.9/5 (38)
It is essential that each class grouping or interval in a frequency distribution be ________ and ________.
(Short Answer)
4.9/5 (35)
TABLE 2-3
Every spring semester, the School of Business coordinates a luncheon with local business leaders for graduating seniors, their families, and friends. Corporate sponsorship pays for the lunches of each of the seniors, but students have to purchase tickets to cover the cost of lunches served to guests they bring with them. The following histogram represents the attendance at the senior luncheon, where X is the number of guests each graduating senior invited to the luncheon and f is the number of graduating seniors in each category.
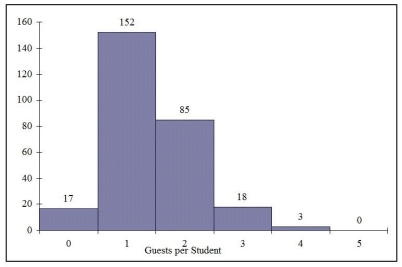 -Referring to the histogram from Table 2-3, if all the tickets purchased were used, how many guests attended the luncheon?
(Multiple Choice)
4.9/5 (33)
TABLE 2-12
The table below contains the opinions of a sample of 200 people broken down by gender about the latest congressional plan to eliminate anti-trust exemptions for professional baseball.
-Referring to Table 2-12, if the sample is a good representation of the population, we can expect ________ percent of the females in the population will not be against the plan.
(Short Answer)
4.8/5 (32)
TABLE 2-1
An insurance company evaluates many numerical variables about a person before deciding on an appropriate rate for automobile insurance. A representative from a local insurance agency selected a random sample of insured drivers and recorded, X, the number of claims each made in the last 3 years, with the following results. 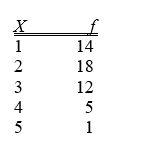 -Referring to Table 2-1, how many total claims are represented in the sample?
(Multiple Choice)
4.8/5 (33)
Apple Computer, Inc. collected information on the age of their customers. The youngest customer was 12 and the oldest was 72. To study the distribution of the age among its customers, it is best to use a pie chart.
(True/False)
4.9/5 (27)
TABLE 2-4
A survey was conducted to determine how people rated the quality of programming available on television. Respondents were asked to rate the overall quality from 0 (no quality at all) to 100 (extremely good quality). The stem-and-leaf display of the data is shown below.
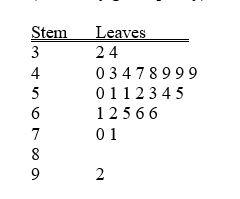 -Referring to Table 2-4, what percentage of the respondents rated overall television quality with a rating from 50 through 75?
(Multiple Choice)
4.9/5 (31)
TABLE 2-1
An insurance company evaluates many numerical variables about a person before deciding on an appropriate rate for automobile insurance. A representative from a local insurance agency selected a random sample of insured drivers and recorded, X, the number of claims each made in the last 3 years, with the following results.
-Referring to Table 2-1, how many drivers are represented in the sample?
(Multiple Choice)
4.8/5 (31)
TABLE 2-12
The table below contains the opinions of a sample of 200 people broken down by gender about the latest congressional plan to eliminate anti-trust exemptions for professional baseball.
-Referring to Table 2-12, if the sample is a good representation of the population, we can expect ________ percent of the population will be for the plant.
(Short Answer)
4.8/5 (38)
TABLE 2-9
The frequency distribution below represents the rents of 250 randomly selected federally subsidized apartments in a small town.
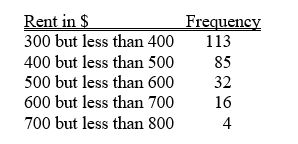 -Referring to Table 2-9, the percentage of apartments renting for less than $600 is ________.
(Short Answer)
4.9/5 (36)
TABLE 2-5
The following are the duration in minutes of a sample of long-distance phone calls made within the continental United States reported by one long-distance carrier.  -Referring to Table 2-5, what is the cumulative relative frequency for the percentage of calls that lasted under 20 minutes?
(Multiple Choice)
4.9/5 (31)
A marketing research firm, in conducting a comparative taste test, provided three types of peanut butter to a sample of households randomly selected within the state. Which of the 4 methods of data collection is involved when people are asked to compare the three types of peanut butter?
(Multiple Choice)
4.9/5 (32)
TABLE 2-14
The table below contains the number of people who own a portable DVD player in a sample of 600 broken down by gender.
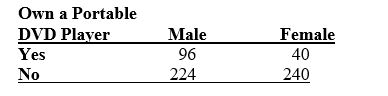 -Referring to Table 2-14, construct a table of row percentages.
(Essay)
4.8/5 (31)
Filters
- Essay(0)
- Multiple Choice(0)
- Short Answer(0)
- True False(0)
- Matching(0)