Exam 2: Organizing and Visualizing Data
Exam 1: Introduction145 Questions
Exam 2: Organizing and Visualizing Data210 Questions
Exam 3: Numerical Descriptive Measures153 Questions
Exam 4: Basic Probability171 Questions
Exam 5: Discrete Probability Distributions218 Questions
Exam 6: The Normal Distribution and Other Continuous Distributions191 Questions
Exam 7: Sampling and Sampling Distributions197 Questions
Exam 8: Confidence Interval Estimation196 Questions
Exam 9: Fundamentals of Hypothesis Testing: One-Sample Tests165 Questions
Exam 10: Two-Sample Tests210 Questions
Exam 11: Analysis of Variance213 Questions
Exam 12: Chi-Square Tests and Nonparametric Tests201 Questions
Exam 13: Simple Linear Regression213 Questions
Exam 14: Introduction to Multiple Regression355 Questions
Exam 15: Multiple Regression Model Building96 Questions
Exam 16: Time-Series Forecasting168 Questions
Exam 17: Statistical Applications in Quality Management133 Questions
Exam 18: A Roadmap for Analyzing Data54 Questions
Exam 19: Questions that Involve Online Topics321 Questions
Select questions type
TABLE 2-9
The frequency distribution below represents the rents of 250 randomly selected federally subsidized apartments in a small town.
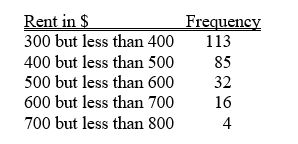 -Referring to Table 2-9, ________ percent of the apartments rented for $600 or more.
(Short Answer)
4.9/5  (35)
(35)
In order to compare one large set of numerical data to another, a ________ distribution must be developed from the frequency distribution.
(Essay)
4.9/5 (32)
TABLE 2-9
The frequency distribution below represents the rents of 250 randomly selected federally subsidized apartments in a small town.
-Referring to Table 2-9, ________ apartments rented for at least $400 but less than $600.
(Short Answer)
4.9/5 (36)
TABLE 2-8
The Stem-and-Leaf display represents the number of times in a year that a random sample of 100 "lifetime" members of a health club actually visited the facility.
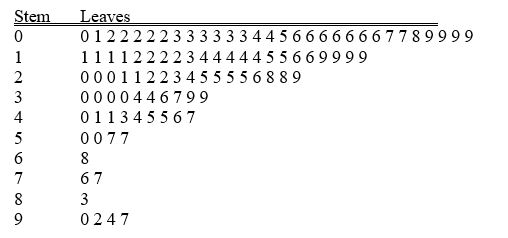 -Referring to Table 2-8, if a frequency distribution with equal sized classes was made from this data, and the first class was "0 but less than 10," the relative frequency of the last class would be ________.
(Short Answer)
4.7/5 (37)
TABLE 2-17
The following table presents total retail sales in millions of dollars for the leading apparel companies during April 2009 and April 2010.
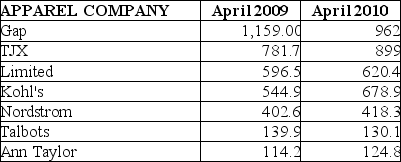 -Referring to Table 2-17, in general, retail sales for the apparel industry have seen a modest growth between April 2008 and April 2009.
(True/False)
4.9/5 (41)
When constructing charts, the following is plotted at the class midpoints:
(Multiple Choice)
4.9/5 (35)
TABLE 2-15
The figure below is the ogive for the amount of fat (in grams) for a sample of 36 pizza products where the upper boundaries of the intervals are: 5, 10, 15, 20, 25, and 30.
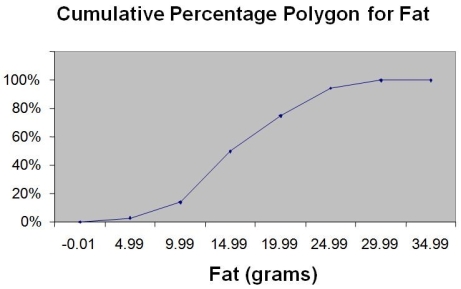 -Referring to Table 2-15, what percentage of pizza products contains between 10 and 25 grams of fat?
(Multiple Choice)
4.8/5 (25)
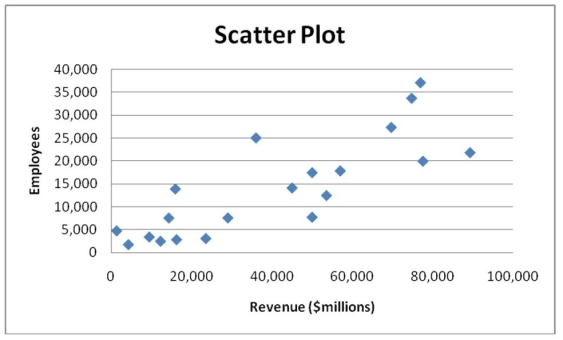
Given below is the scatter plot of the number of employees and the total revenue ($millions) of 20 U.S. companies. There appears to be a positive relationship between total revenue and the number of employees.
(True/False)
4.9/5 (39)
TABLE 2-10
The histogram below represents scores achieved by 200 job applicants on a personality profile.
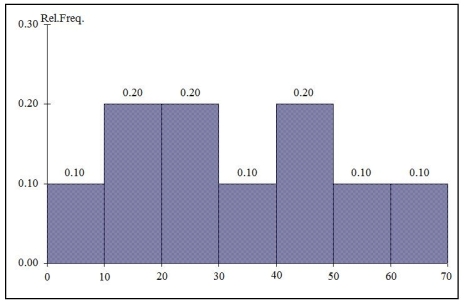 -Referring to the histogram from Table 2-10, 90% of the job applicants scored above or equal to ________.
(Short Answer)
5.0/5 (35)
TABLE 2-13
Given below is the stem-and-leaf display representing the amount of detergent used in gallons (with leaves in tenths of gallons) in a day by 25 drive-through car wash operations in Phoenix.
9 | 1 4 7
10 | 0 2 2 3 8
11 | 1 3 5 5 6 6 7 7 7
12 | 2 2 3 4 8 9
13 | 0 2
-Referring to Table 2-13, construct a percentage histogram for the detergent data, using "9.0 but less than 10.0" as the first class.
(Essay)
4.8/5 (35)
TABLE 2-13
Given below is the stem-and-leaf display representing the amount of detergent used in gallons (with leaves in tenths of gallons) in a day by 25 drive-through car wash operations in Phoenix.
9 | 1 4 7
10 | 0 2 2 3 8
11 | 1 3 5 5 6 6 7 7 7
12 | 2 2 3 4 8 9
13 | 0 2
-Referring to Table 2-13, construct a cumulative percentage distribution for the detergent data if the corresponding frequency distribution uses "9.0 but less than 10.0" as the first class.
(Essay)
4.7/5 (30)
The larger the number of observations in a numerical data set, the larger the number of class intervals needed for a grouped frequency distribution.
(True/False)
4.9/5 (27)
In general, a frequency distribution should have at least 8 class groups but no more than 20.
(True/False)
4.8/5 (30)
A study attempted to estimate the proportion of Florida residents who were willing to spend more tax dollars on protecting the beaches from environmental disasters. Twenty-five hundred Florida residents were surveyed. What type of data collection procedure was most likely used to collect the data for this study?
(Multiple Choice)
4.9/5 (39)
You have collected data on the number of U.S. households actively using online banking and/or online bill payment from 1995 to 2010. Which of the following is the best for presenting the data?
(Multiple Choice)
4.8/5 (32)
A research analyst was directed to arrange raw data collected on the yield of wheat, ranging from 40 to 93 bushels per acre, in a frequency distribution. He should choose 30 as the class interval width.
(True/False)
4.9/5 (35)
TABLE 2-12
The table below contains the opinions of a sample of 200 people broken down by gender about the latest congressional plan to eliminate anti-trust exemptions for professional baseball. 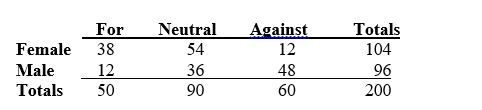 -Referring to Table 2-12, of the females in the sample, ________ percent were against the plan.
(Short Answer)
4.8/5 (26)
Jared was working on a project to look at global warming and accessed an Internet site where he captured average global surface temperatures from 1866. Which of the four methods of data collection was he using?
(Multiple Choice)
4.7/5 (40)
TABLE 2-5
The following are the duration in minutes of a sample of long-distance phone calls made within the continental United States reported by one long-distance carrier.  -Referring to Table 2-5, if 100 calls were randomly sampled, ________ of them would have lasted at least 15 minutes but less than 20 minutes.
(Multiple Choice)
4.8/5 (35)
TABLE 2-10
The histogram below represents scores achieved by 200 job applicants on a personality profile.
-Referring to the histogram from Table 2-10, ________ percent of the job applicants scored below 50.
(Short Answer)
4.9/5 (33)
Filters
- Essay(0)
- Multiple Choice(0)
- Short Answer(0)
- True False(0)
- Matching(0)