Exam 2: Organizing and Visualizing Data
Exam 1: Introduction145 Questions
Exam 2: Organizing and Visualizing Data210 Questions
Exam 3: Numerical Descriptive Measures153 Questions
Exam 4: Basic Probability171 Questions
Exam 5: Discrete Probability Distributions218 Questions
Exam 6: The Normal Distribution and Other Continuous Distributions191 Questions
Exam 7: Sampling and Sampling Distributions197 Questions
Exam 8: Confidence Interval Estimation196 Questions
Exam 9: Fundamentals of Hypothesis Testing: One-Sample Tests165 Questions
Exam 10: Two-Sample Tests210 Questions
Exam 11: Analysis of Variance213 Questions
Exam 12: Chi-Square Tests and Nonparametric Tests201 Questions
Exam 13: Simple Linear Regression213 Questions
Exam 14: Introduction to Multiple Regression355 Questions
Exam 15: Multiple Regression Model Building96 Questions
Exam 16: Time-Series Forecasting168 Questions
Exam 17: Statistical Applications in Quality Management133 Questions
Exam 18: A Roadmap for Analyzing Data54 Questions
Exam 19: Questions that Involve Online Topics321 Questions
Select questions type
One of the advantages of a pie chart is that it clearly shows that the total of all the categories of the pie adds to 100%.
(True/False)
4.9/5  (33)
(33)
TABLE 2-12
The table below contains the opinions of a sample of 200 people broken down by gender about the latest congressional plan to eliminate anti-trust exemptions for professional baseball. 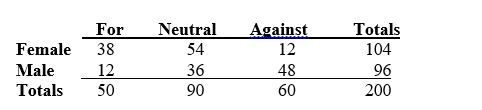 -Referring to Table 2-12, if the sample is a good representation of the population, we can expect ________ percent of those for the plan in the population will be males.
(Short Answer)
4.9/5 (47)
TABLE 2-18
The stem-and-leaf display below shows the result of a survey on 50 students on their satisfaction with their school with the higher scores represent higher level of satisfaction.
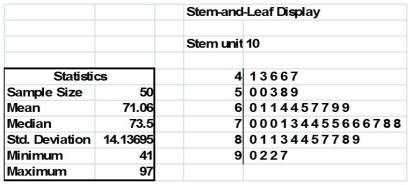 -Referring to Table 2-18, how many students have a satisfaction level of at least 80?
(Short Answer)
4.9/5 (33)
TABLE 2-12
The table below contains the opinions of a sample of 200 people broken down by gender about the latest congressional plan to eliminate anti-trust exemptions for professional baseball.
-Referring to Table 2-12, of those neutral in the sample, ________ percent were males.
(Short Answer)
4.9/5 (36)
TABLE 2-12
The table below contains the opinions of a sample of 200 people broken down by gender about the latest congressional plan to eliminate anti-trust exemptions for professional baseball.
-Referring to Table 2-12, ________ percent of the 200 were males who were neutral.
(Short Answer)
4.8/5 (48)
TABLE 2-18
The stem-and-leaf display below shows the result of a survey on 50 students on their satisfaction with their school with the higher scores represent higher level of satisfaction.
-Referring to Table 2-18, how many students have a satisfaction level below 60?
(Short Answer)
4.7/5 (30)
TABLE 2-13
Given below is the stem-and-leaf display representing the amount of detergent used in gallons (with leaves in tenths of gallons) in a day by 25 drive-through car wash operations in Phoenix.
9 | 1 4 7
10 | 0 2 2 3 8
11 | 1 3 5 5 6 6 7 7 7
12 | 2 2 3 4 8 9
13 | 0 2
-Referring to Table 2-13, if a percentage histogram for the detergent data is constructed, using "9.0 but less than 10.0 gallons" as the first class, what percentage of drive-through car wash operations use less than 12 gallons of detergent in a day?
(Short Answer)
4.8/5 (30)
TABLE 2-10
The histogram below represents scores achieved by 200 job applicants on a personality profile.
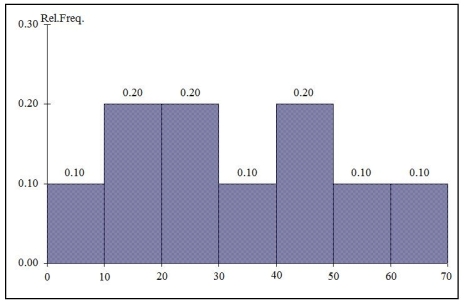 -Referring to the histogram from Table 2-10, ________ percent of the applicants scored between 20 and below 50.
(Short Answer)
4.9/5 (32)
TABLE 2-12
The table below contains the opinions of a sample of 200 people broken down by gender about the latest congressional plan to eliminate anti-trust exemptions for professional baseball.
-Referring to Table 2-12, ________ percent of the 200 were females who were either neutral or against the plan.
(Short Answer)
4.8/5 (30)
A ________ is a summary table in which numerical data are tallied into class intervals or categories.
(Short Answer)
4.9/5 (33)
Which of the following is appropriate for displaying data collected on the different brands of cars students at a major university drive?
(Multiple Choice)
4.8/5 (26)
TABLE 2-12
The table below contains the opinions of a sample of 200 people broken down by gender about the latest congressional plan to eliminate anti-trust exemptions for professional baseball.
-Referring to Table 2-12, ________ percent of the 200 were against the plan.
(Short Answer)
4.8/5 (30)
Given below is the scatter plot of the market value (thousands$) and profit (thousands$) of 50 U.S. companies. There appears to be a negative relationship between market value and profit.
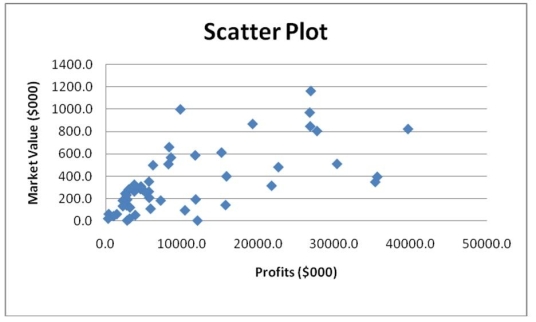
(True/False)
4.9/5 (37)
You have collected data on the number of complaints for 6 different brands of automobiles sold in the US in 2006 and in 2010. Which of the following is the best for presenting the data?
(Multiple Choice)
4.9/5 (32)
TABLE 2-15
The figure below is the ogive for the amount of fat (in grams) for a sample of 36 pizza products where the upper boundaries of the intervals are: 5, 10, 15, 20, 25, and 30.
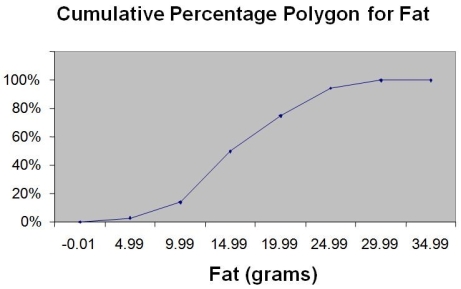 -Referring to Table 2-15, what percentage of pizza products contains at least 20 grams of fat?
(Multiple Choice)
4.9/5 (39)
TABLE 2-14
The table below contains the number of people who own a portable DVD player in a sample of 600 broken down by gender.
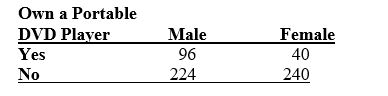 -Referring to Table 2-14, of those who owned a portable DVD in the sample, ________ percent were females.
(Short Answer)
4.8/5 (25)
The point halfway between the boundaries of each class interval in a grouped frequency distribution is called the ________.
(Short Answer)
4.9/5 (24)
You have collected data on the monthly seasonally adjusted civilian unemployment rate for the United States from 1998 to 2010. Which of the following is the best for presenting the data?
(Multiple Choice)
4.9/5 (31)
TABLE 2-14
The table below contains the number of people who own a portable DVD player in a sample of 600 broken down by gender.
-Referring to Table 2-14, if the sample is a good representation of the population, we can expect ________ percent of the females in the population will not own a portable DVD.
(Short Answer)
4.9/5 (38)
Filters
- Essay(0)
- Multiple Choice(0)
- Short Answer(0)
- True False(0)
- Matching(0)