Exam 2: Organizing and Visualizing Data
Exam 1: Introduction145 Questions
Exam 2: Organizing and Visualizing Data210 Questions
Exam 3: Numerical Descriptive Measures153 Questions
Exam 4: Basic Probability171 Questions
Exam 5: Discrete Probability Distributions218 Questions
Exam 6: The Normal Distribution and Other Continuous Distributions191 Questions
Exam 7: Sampling and Sampling Distributions197 Questions
Exam 8: Confidence Interval Estimation196 Questions
Exam 9: Fundamentals of Hypothesis Testing: One-Sample Tests165 Questions
Exam 10: Two-Sample Tests210 Questions
Exam 11: Analysis of Variance213 Questions
Exam 12: Chi-Square Tests and Nonparametric Tests201 Questions
Exam 13: Simple Linear Regression213 Questions
Exam 14: Introduction to Multiple Regression355 Questions
Exam 15: Multiple Regression Model Building96 Questions
Exam 16: Time-Series Forecasting168 Questions
Exam 17: Statistical Applications in Quality Management133 Questions
Exam 18: A Roadmap for Analyzing Data54 Questions
Exam 19: Questions that Involve Online Topics321 Questions
Select questions type
TABLE 2-8
The Stem-and-Leaf display represents the number of times in a year that a random sample of 100 "lifetime" members of a health club actually visited the facility.
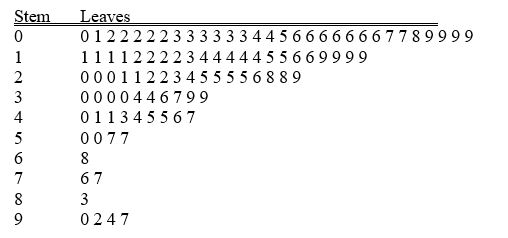 -Referring to Table 2-8, the person who visited the health club less than anyone else in the sample visited the facility ________ times.
(Short Answer)
4.9/5  (39)
(39)
TABLE 2-9
The frequency distribution below represents the rents of 250 randomly selected federally subsidized apartments in a small town.
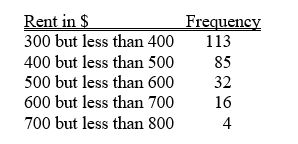 -Referring to Table 2-9, the relative frequency of the second class is ________.
(Short Answer)
4.9/5 (42)
TABLE 2-14
The table below contains the number of people who own a portable DVD player in a sample of 600 broken down by gender.
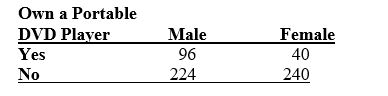 -Referring to Table 2-14, construct a table of total percentages.
(Essay)
4.8/5 (33)
Retailers are always interested in determining why a customer selected their store to make a purchase. A sporting goods retailer conducted a customer survey to determine why its customers shopped at the store. The results are shown in the bar chart below. What proportion of the customers responded that they shopped at the store because of the merchandise or the convenience? 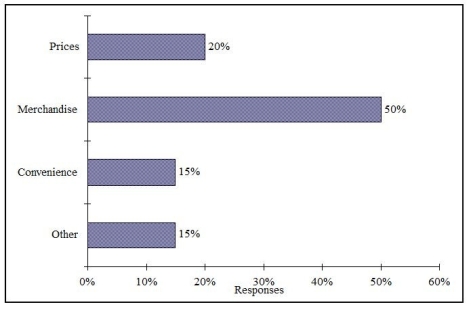
(Multiple Choice)
4.9/5 (25)
TABLE 2-11
The ordered array below resulted from selecting a sample of 25 batches of 500 computer chips and determining how many in each batch were defective.
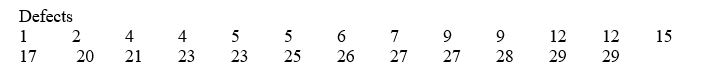 -Referring to Table 2-11, construct a relative frequency or percentage distribution for the defects data, using "0 but less than 5" as the first class.
(Essay)
4.9/5 (35)
TABLE 2-18
The stem-and-leaf display below shows the result of a survey on 50 students on their satisfaction with their school with the higher scores represent higher level of satisfaction.
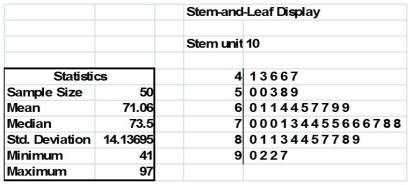 -Referring to Table 2-18, if a student is randomly selected, his/her most likely level of satisfaction will be in the 70s among the 40s, 50s, 60s, 70s, 80s and 90s.
(True/False)
4.8/5 (30)
TABLE 2-11
The ordered array below resulted from selecting a sample of 25 batches of 500 computer chips and determining how many in each batch were defective.
-Referring to Table 2-11, construct a frequency distribution for the defects data, using "0 but less than 5" as the first class.
(Essay)
4.8/5 (31)
TABLE 2-14
The table below contains the number of people who own a portable DVD player in a sample of 600 broken down by gender.
-Referring to Table 2-14, ________ percent of the 600 owned a portable DVD.
(Short Answer)
4.9/5 (42)
TABLE 2-4
A survey was conducted to determine how people rated the quality of programming available on television. Respondents were asked to rate the overall quality from 0 (no quality at all) to 100 (extremely good quality). The stem-and-leaf display of the data is shown below.
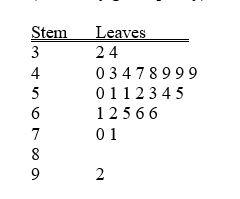 -Referring to Table 2-4, what percentage of the respondents rated overall television quality with a rating of 50 or below?
(Multiple Choice)
4.8/5 (37)
TABLE 2-12
The table below contains the opinions of a sample of 200 people broken down by gender about the latest congressional plan to eliminate anti-trust exemptions for professional baseball. 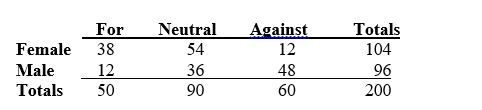 -Referring to Table 2-12, ________ percent of the 200 were females who were against the plan.
(Short Answer)
4.8/5 (34)
Histograms are used for numerical data while bar charts are suitable for categorical data.
(True/False)
4.7/5 (28)
TABLE 2-14
The table below contains the number of people who own a portable DVD player in a sample of 600 broken down by gender.
-Referring to Table 2-14 of the females in the sample, ________ percent owned a portable DVD.
(Short Answer)
4.8/5 (27)
A Wal-Mart store in a small town monitors customer complaints and organizes these complaints into six distinct categories. Over the past year, the company has received 534 complaints. One possible graphical method for representing these data would be a Pareto chart.
(True/False)
4.8/5 (31)
TABLE 2-8
The Stem-and-Leaf display represents the number of times in a year that a random sample of 100 "lifetime" members of a health club actually visited the facility.
-Referring to Table 2-8, the person who has the largest leaf associated with the smallest stem visited the facility ________ times.
(Short Answer)
4.8/5 (36)
TABLE 2-17
The following table presents total retail sales in millions of dollars for the leading apparel companies during April 2009 and April 2010.
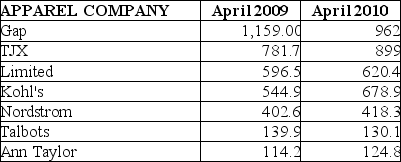 -Referring to Table 2-17, among the 8 stores, ________ saw a sales decline.
(Short Answer)
4.8/5 (40)
The width of each class grouping or interval in a frequency distribution should be ________.
(Short Answer)
4.8/5 (42)
Given below is the scatter plot of the price/earnings ratio versus earnings per share of 20 U.S. companies. There appear to be a positive relationship between price/earnings ratio and earnings per share.
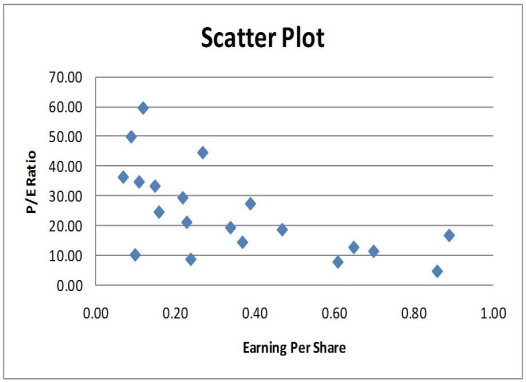
(True/False)
5.0/5 (35)
Given below is the scatter plot of the number of employees and the total revenue ($millions) of 20 U.S. companies. Companies that have higher numbers of employees appear to also have higher total revenue.
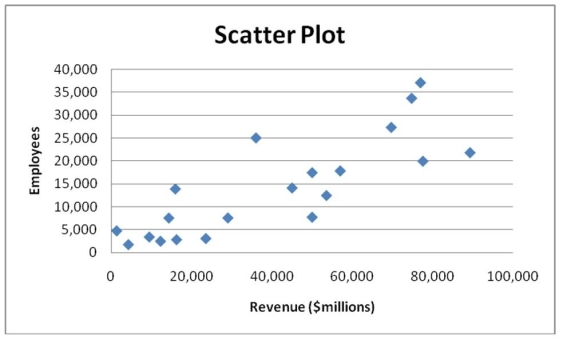
(True/False)
4.8/5 (33)
TABLE 2-6
A sample of 200 students at a Big-Ten university was taken after the midterm to ask them whether they went bar hopping the weekend before the midterm or spent the weekend studying, and whether they did well or poorly on the midterm. The following table contains the result.
 -Referring to Table 2-6, ________ percent of the students in the sample spent the weekend studying and did well on the midterm.
(Multiple Choice)
4.8/5 (35)
Filters
- Essay(0)
- Multiple Choice(0)
- Short Answer(0)
- True False(0)
- Matching(0)