Exam 2: Organizing and Visualizing Data
Exam 1: Introduction145 Questions
Exam 2: Organizing and Visualizing Data210 Questions
Exam 3: Numerical Descriptive Measures153 Questions
Exam 4: Basic Probability171 Questions
Exam 5: Discrete Probability Distributions218 Questions
Exam 6: The Normal Distribution and Other Continuous Distributions191 Questions
Exam 7: Sampling and Sampling Distributions197 Questions
Exam 8: Confidence Interval Estimation196 Questions
Exam 9: Fundamentals of Hypothesis Testing: One-Sample Tests165 Questions
Exam 10: Two-Sample Tests210 Questions
Exam 11: Analysis of Variance213 Questions
Exam 12: Chi-Square Tests and Nonparametric Tests201 Questions
Exam 13: Simple Linear Regression213 Questions
Exam 14: Introduction to Multiple Regression355 Questions
Exam 15: Multiple Regression Model Building96 Questions
Exam 16: Time-Series Forecasting168 Questions
Exam 17: Statistical Applications in Quality Management133 Questions
Exam 18: A Roadmap for Analyzing Data54 Questions
Exam 19: Questions that Involve Online Topics321 Questions
Select questions type
TABLE 2-6
A sample of 200 students at a Big-Ten university was taken after the midterm to ask them whether they went bar hopping the weekend before the midterm or spent the weekend studying, and whether they did well or poorly on the midterm. The following table contains the result.
 -Referring to Table 2-6, ________ percent of the students in the sample went bar hopping the weekend before the midterm and did well on the midterm.
(Multiple Choice)
4.8/5  (38)
(38)
TABLE 2-11
The ordered array below resulted from selecting a sample of 25 batches of 500 computer chips and determining how many in each batch were defective.
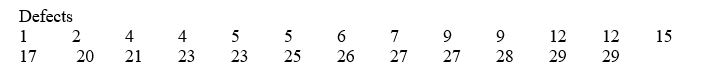 -Referring to Table 2-11, if a frequency distribution for the defects data is constructed, using "0 but less than 5" as the first class, the frequency of the "20 but less than 25" class would be ________.
(Short Answer)
4.7/5 (35)
When comparing two or more large sets of numerical data, the distributions being developed should use the same ________.
(Short Answer)
4.8/5 (25)
TABLE 2-14
The table below contains the number of people who own a portable DVD player in a sample of 600 broken down by gender.
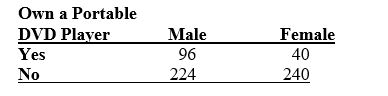 -Referring to Table 2-14, if the sample is a good representation of the population, we can expect ________ percent of those who own a portable DVD in the population will be males.
(Short Answer)
4.8/5 (36)
Data on 1,500 students' height were collected at a larger university in the East Coast. Which of the following is the best chart for presenting the information?
(Multiple Choice)
4.8/5 (32)
In constructing a polygon, each class grouping is represented by its ________ and then these are consecutively connected to one another.
(Short Answer)
4.9/5 (38)
TABLE 2-6
A sample of 200 students at a Big-Ten university was taken after the midterm to ask them whether they went bar hopping the weekend before the midterm or spent the weekend studying, and whether they did well or poorly on the midterm. The following table contains the result.
-Referring to Table 2-6, if the sample is a good representation of the population, we can expect ________ percent of those who did poorly on the midterm to have spent the weekend studying.
(Multiple Choice)
4.7/5 (33)
Given below is the scatter plot of the price/earnings ratio versus earnings per share of 20 U.S. companies. There appears to be a negative relationship between price/earnings ratio and earnings per share.
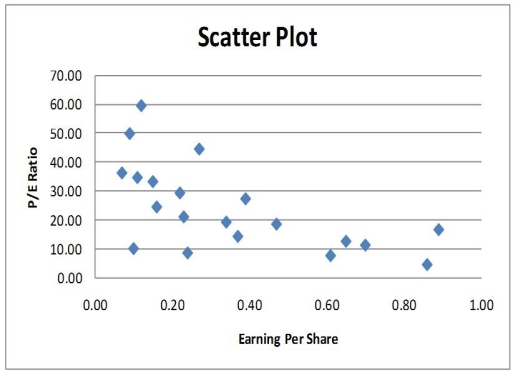
(True/False)
4.8/5 (34)
When constructing a frequency distribution, classes should be selected so that they are of equal width.
(True/False)
4.9/5 (37)
TABLE 2-14
The table below contains the number of people who own a portable DVD player in a sample of 600 broken down by gender.
-Referring to Table 2-14, ________ percent of the 600 were females who owned a portable DVD.
(Short Answer)
4.7/5 (41)
TABLE 2-5
The following are the duration in minutes of a sample of long-distance phone calls made within the continental United States reported by one long-distance carrier.  -Referring to Table 2-5, if 1,000 calls were randomly sampled, how many calls lasted under 10 minutes?
(Multiple Choice)
4.7/5 (38)
TABLE 2-5
The following are the duration in minutes of a sample of long-distance phone calls made within the continental United States reported by one long-distance carrier.
-Referring to Table 2-5, if 100 calls were sampled, ________ of them would have lasted less than 5 minutes or at least 30 minutes or more.
(Multiple Choice)
4.9/5 (31)
You have collected information on the consumption by the 15 largest coffee-consuming nations. Which of the following is the best for presenting the shares of the consumption?
(Multiple Choice)
4.8/5 (40)
Percentage polygons are plotted at the boundaries of the class groupings.
(True/False)
4.8/5 (41)
A survey of 150 executives were asked what they think is the most common mistake candidates make during job interviews. Six different mistakes were given. Which of the following is the best for presenting the information?
(Multiple Choice)
4.9/5 (34)
TABLE 2-12
The table below contains the opinions of a sample of 200 people broken down by gender about the latest congressional plan to eliminate anti-trust exemptions for professional baseball. 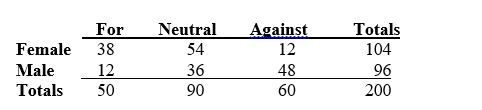 -Referring to Table 2-12, of the females in the sample, ________ percent were either neutral or against the plan.
(Short Answer)
4.8/5 (28)
TABLE 2-14
The table below contains the number of people who own a portable DVD player in a sample of 600 broken down by gender.
-Referring to Table 2-14, of the males in the sample, ________ percent owned a portable DVD.
(Short Answer)
4.8/5 (34)
TABLE 2-7
The Stem-and-Leaf display below contains data on the number of months between the date a civil suit is filed and when the case is actually adjudicated for 50 cases heard in superior court.
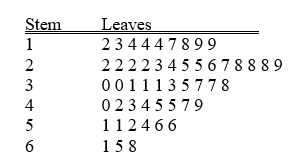 -Referring to Table 2-7, ________ percent of the cases were not adjudicated within the first 4 years.
(Short Answer)
4.8/5 (38)
TABLE 2-6
A sample of 200 students at a Big-Ten university was taken after the midterm to ask them whether they went bar hopping the weekend before the midterm or spent the weekend studying, and whether they did well or poorly on the midterm. The following table contains the result.
-Referring to Table 2-6, if the sample is a good representation of the population, we can expect ________ percent of those who spent the weekend studying to do poorly on the midterm.
(Multiple Choice)
4.8/5 (36)
TABLE 2-11
The ordered array below resulted from selecting a sample of 25 batches of 500 computer chips and determining how many in each batch were defective.
-Referring to Table 2-11, if a frequency distribution for the defects data is constructed, using "0 but less than 5" as the first class, the relative frequency of the "15 but less than 20" class would be ________.
(Short Answer)
4.9/5 (41)
Filters
- Essay(0)
- Multiple Choice(0)
- Short Answer(0)
- True False(0)
- Matching(0)