Exam 2: Rate of Change: the Derivative
Exam 1: Functions and Change204 Questions
Exam 2: Rate of Change: the Derivative132 Questions
Exam 3: Shortcuts to Differentiation178 Questions
Exam 4: Using the Derivative94 Questions
Exam 5: Accumulated Change: the Definite Integral93 Questions
Exam 6: Antiderivatives and Applications122 Questions
Exam 7: Probability68 Questions
Exam 8: Functions of Several Variables134 Questions
Exam 9: Mathematical Modeling Using Differential Equations121 Questions
Exam 10: Geometric Series65 Questions
Select questions type
The cost of mining a ton of coal is rising faster every year. Suppose  is the cost of mining a ton of coal at time t. Which of the following must be concave up? Select all that apply.
(Multiple Choice)
4.7/5  (38)
(38)
Let  represent the number of students enrolled in school in the year t. If enrollment is decreasing steadily, then
  _____0 and
  _____0. (Enter "<",">", or "=")
(Short Answer)
4.8/5 (41)
Cost and revenue functions for a certain chemical manufacturer are given in the following figure. Should the company increase production beyond 25 tons? 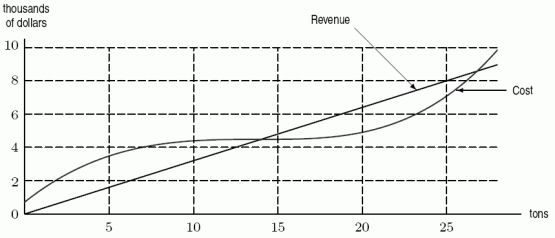
(Multiple Choice)
5.0/5 (41)
To produce 250 items the total cost is $4700 and the marginal cost is $15. Which estimate is more likely to be accurate, one for producing 251 items, or one for producing 500 items?
(Short Answer)
4.9/5 (38)
Given the following data about the function f, the equation of the tangent line at x=3.2 is approximately y = _____x+_____. Use the nearest right-hand value to make your estimate. 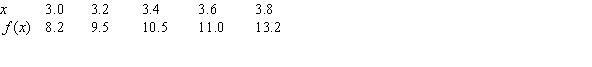
(Short Answer)
4.7/5 (38)
Assume that f and g are differentiable functions defined on all of the real line. f and g can satisfy:  for all x and
  for all x.
(True/False)
4.8/5 (32)
A certain bacterial colony was observed for several hours and the following conditions were reported. Let  be the number of bacteria present after t hours.
  There were 1000 bacteria after 5 hours.
  The growth rate was never negative and never exceeded 100 per hour.
  The growth rate was decreasing for the first 5 hours.
  At 7 hours, the growth rate was zero.
Is it possible that
At 7 hours, the growth rate was zero.
Is it possible that  ?
?
(Short Answer)
4.9/5 (39)
To study traffic flow along a major road, the city installs a device at the edge of the road at 4:00 am. The device counts the cars driving past, and records the total periodically. The resulting data is plotted on a graph, with time (in hours) on the horizontal axis and the number of cars on the vertical axis. The graph is shown below. It is a graph of the function  = Total number of cars that have passed by after t hours. When is the traffic flow the greatest?
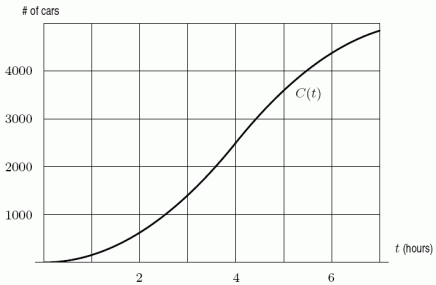
(Multiple Choice)
4.8/5 (37)
The cost of mining a ton of coal is rising faster every year. Suppose  is the cost of mining a ton of coal at time t. Which of the following must be increasing? Select all that apply.
(Multiple Choice)
4.7/5 (33)
The following table gives the cost and revenue, in dollars, for different production levels, q. What are the fixed costs? 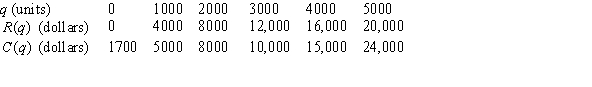
(Short Answer)
4.9/5 (36)
A certain bacterial colony was observed for several hours and the following conditions were reported. Let  be the number of bacteria present after t hours.
  There were 1000 bacteria after 5 hours.
  The growth rate was never negative and never exceeded 100 per hour.
  The growth rate was decreasing for the first 5 hours.
  At 7 hours, the growth rate was zero.
Is it possible that
At 7 hours, the growth rate was zero.
Is it possible that  ?
?
(Short Answer)
4.8/5 (38)
Recently Esther swam a lap in an Olympic swimming pool (the length of the pool is 50 meters, and the length of a lap is 100 meters); her times for various positions s (in meters from her starting point) during the lap are given in the following table. Her approximate velocity at time t=3.2 seconds was _____ m/sec. Round to 3 decimal places. 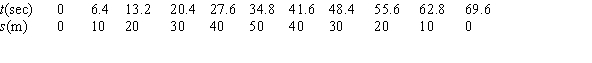
(Short Answer)
4.8/5 (41)
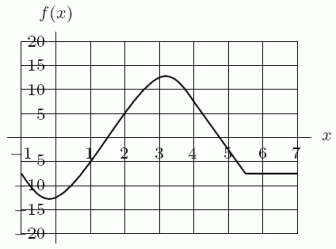
The graph of  is shown in the following figure. Give an estimate for
(Multiple Choice)
4.9/5 (44)
Consider the function f sketched in the following figure. Do you expect  to be positive, negative, or zero?
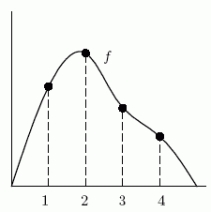
(Short Answer)
4.9/5 (42)
Given the following data about the function f, give the average rate of change of f between x=3.2 and x=3.8. Round to 2 decimal places. 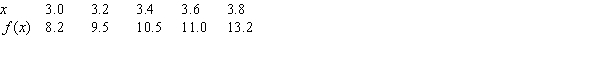
(Short Answer)
4.7/5 (48)
The following table shows the number of oranges sold in one month,  , against the price per bag, p (in cents). Find an approximation for
  . Use the nearest right-hand value to make your estimate.
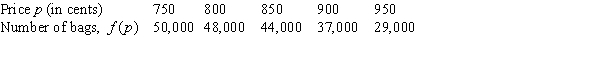
(Short Answer)
4.8/5 (43)
Cost and revenue functions for a certain chemical manufacturer are given in the following figure. Marginal revenue at 20 tons is about how much? 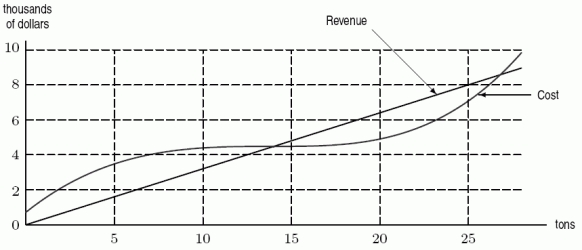
(Multiple Choice)
4.7/5 (43)
Filters
- Essay(0)
- Multiple Choice(0)
- Short Answer(0)
- True False(0)
- Matching(0)