Exam 2: Rate of Change: the Derivative
Exam 1: Functions and Change204 Questions
Exam 2: Rate of Change: the Derivative132 Questions
Exam 3: Shortcuts to Differentiation178 Questions
Exam 4: Using the Derivative94 Questions
Exam 5: Accumulated Change: the Definite Integral93 Questions
Exam 6: Antiderivatives and Applications122 Questions
Exam 7: Probability68 Questions
Exam 8: Functions of Several Variables134 Questions
Exam 9: Mathematical Modeling Using Differential Equations121 Questions
Exam 10: Geometric Series65 Questions
Select questions type
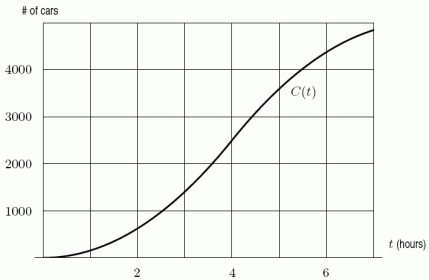
To study traffic flow along a major road, the city installs a device at the edge of the road at 4:00 am. The device counts the cars driving past, and records the total periodically. The resulting data is plotted on a graph, with time (in hours) on the horizontal axis and the number of cars on the vertical axis. The graph is shown below. It is a graph of the function  = Total number of cars that have passed by after t hours. Estimate
  .
. 
(Multiple Choice)
4.9/5  (39)
(39)
The following table gives the cost and revenue, in dollars, for different production levels, q. For what value of q is profit maximized? 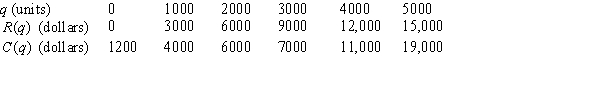
(Short Answer)
4.9/5 (39)
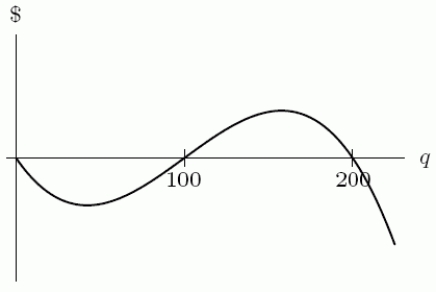
Cost and revenue functions are graphed in the first figure. What does the second figure show? 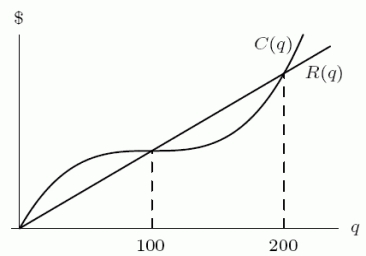
(Multiple Choice)
5.0/5 (36)
Estimate  when
when  . Take smaller and smaller intervals until your estimate is accurate to 3 decimal places.
(Short Answer)
4.8/5 (42)
An amount of $500 was invested in 1970 and the investment grew as shown in the following table. (Amounts are given for the beginning of the year.) The average rate of increase of the investment between 1980 and 1990 is _____ per year. 
(Short Answer)
4.8/5 (39)
The graph below is the graph of  , the derivative of
  . At 2 is the original function M(x) increasing, decreasing, constant or undefined?
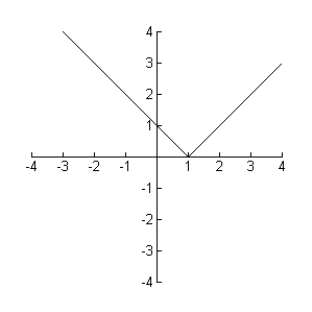
(Short Answer)
4.8/5 (38)
The growth graph in the following figure shows the height in inches of a bean plant during 30 days. On the 15th day, the plant was growing about _____ inches/day. Round to 2 decimal places. 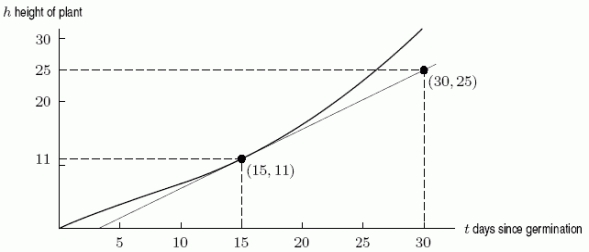
(Short Answer)
4.7/5 (30)
Consider the following graph. In region III,  is ________ (positive/negative) and
  is ________ (positive/negative).
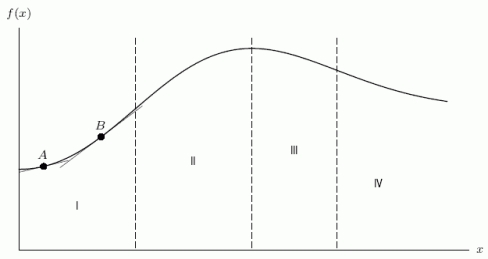
(Short Answer)
4.8/5 (35)
The noise level, N, in decibels, of a rock concert is given by  , where d is the distance in meters from the concert speakers. Which of the following gives the distance, in meters, away from the speakers at which the noise is 80 decibels?
(Multiple Choice)
4.7/5 (45)
Let  represent the dollar amount charged per hour by a computer consultant to a client when they sign a contract t hours of work. The consultant gives a discount to the client if the contract is increased by 10 hours. Interpret the following statements.
A)
represent the dollar amount charged per hour by a computer consultant to a client when they sign a contract t hours of work. The consultant gives a discount to the client if the contract is increased by 10 hours. Interpret the following statements.
A)  .
B)
.
B)  .
.
(Essay)
4.8/5 (35)
Using a calculator, estimate the derivative of  at x = 0. Make sure your calculator is set to radians.
(Short Answer)
4.7/5 (41)
Filters
- Essay(0)
- Multiple Choice(0)
- Short Answer(0)
- True False(0)
- Matching(0)