Exam 2: Rate of Change: the Derivative
Exam 1: Functions and Change204 Questions
Exam 2: Rate of Change: the Derivative132 Questions
Exam 3: Shortcuts to Differentiation178 Questions
Exam 4: Using the Derivative94 Questions
Exam 5: Accumulated Change: the Definite Integral93 Questions
Exam 6: Antiderivatives and Applications122 Questions
Exam 7: Probability68 Questions
Exam 8: Functions of Several Variables134 Questions
Exam 9: Mathematical Modeling Using Differential Equations121 Questions
Exam 10: Geometric Series65 Questions
Select questions type
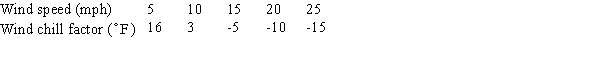
The following table gives the wind chill factor (  ) as a function of the wind speed (miles/hour) when the air temperature is 20
  . What are the units for the derivative of wind chill with respect to wind speed when the air temperature is 20
  ?
? 
(Multiple Choice)
4.9/5  (37)
(37)
The following table gives the number of passenger cars, in millions, in the United States, C, as a function of years, t. We have  . Estimate
  . Use the nearest right-hand value to make your estimate.
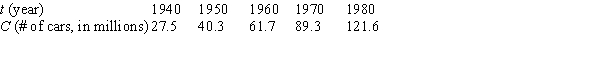
(Multiple Choice)
4.8/5 (30)
Let  be the amount of lumber, in board-feet, produced from a tree of radius r (measured in inches). Which of the following gives the rate of change in the amount of lumber, in board-feet per inch, with respect to the radius when the radius is 21 inches?
(Multiple Choice)
4.8/5 (37)
Let  . Derive an exact formula for the derivative function
  by computing algebraically the limit of a difference quotient.
(Short Answer)
4.8/5 (26)
The graph of a cost function is given in the following figure. Which item costs the most to produce? 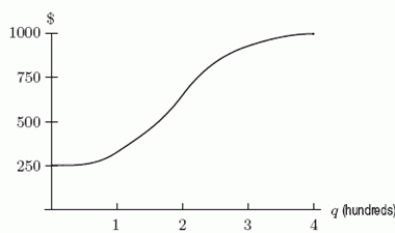
(Multiple Choice)
4.9/5 (35)
Suppose the graph of f is in the figure below. Is  positive, negative, or zero?
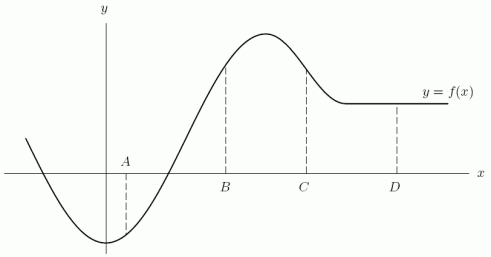
(Short Answer)
4.9/5 (39)
Consider the function f sketched in the following figure. Do you expect  to be positive, negative, or zero?
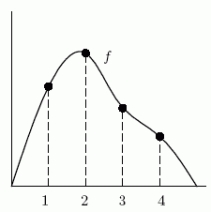
(Short Answer)
4.8/5 (46)
The function  is graphed below.
A. Is
is graphed below.
A. Is  positive, negative, or zero?
B. Is
positive, negative, or zero?
B. Is  positive, negative, or zero?
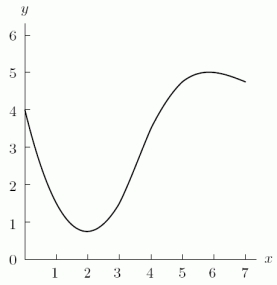
(Short Answer)
4.7/5 (36)
A company graphs  , the derivative of the number of pints of ice cream sold over the past ten years. Out of t=1,2,4,8, and 10, in what year was C ''(t) greatest?
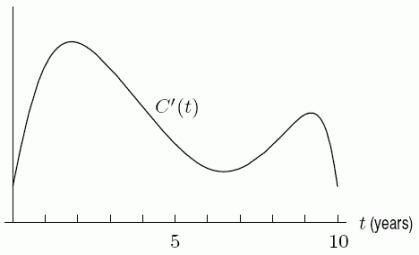
(Short Answer)
4.9/5 (29)
The graph of  in the figure gives the position of a particle at time t. Arrange the following values in order from smallest to largest by placing a "1" by the smallest, a "2" by the next smallest, and so forth.
A. average velocity on
in the figure gives the position of a particle at time t. Arrange the following values in order from smallest to largest by placing a "1" by the smallest, a "2" by the next smallest, and so forth.
A. average velocity on  .
B. average velocity on
.
B. average velocity on  .
C. instantaneous velocity at t=1.
D. instantaneous velocity at t=3.
E. instantaneous velocity at t=10.
.
C. instantaneous velocity at t=1.
D. instantaneous velocity at t=3.
E. instantaneous velocity at t=10. 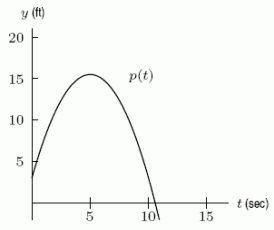
(Short Answer)
4.9/5 (36)
There is a population of  thousand bacteria in a culture at time t hours after the beginning of an experiment. You know that
  ,
,  , and
, and 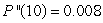 . Using these values, make a prediction for
(Multiple Choice)
4.8/5 (29)
The graph of  is shown in the following figure. Arrange the following values in order from smallest to largest by placing a "1" by the smallest, a "2" by the next smallest, and so forth.
A.
is shown in the following figure. Arrange the following values in order from smallest to largest by placing a "1" by the smallest, a "2" by the next smallest, and so forth.
A.  B.
B.  C.
C.  D.
D.  E.
E. 
(Short Answer)
4.8/5 (35)
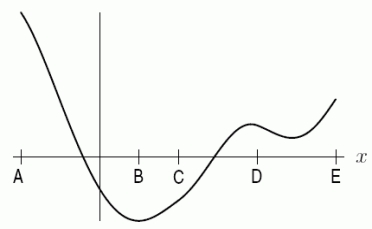
The graph of  is shown below. Arrange the following values in order from smallest to largest by placing a "1" by the smallest, a "2" by the next smallest, and so forth.
A.
is shown below. Arrange the following values in order from smallest to largest by placing a "1" by the smallest, a "2" by the next smallest, and so forth.
A.  B.
B.  C.
C.  D. slope AB E. 1 F. 0
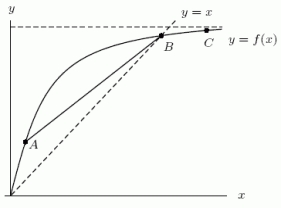
(Short Answer)
4.8/5 (41)
Suppose a function is given by the following table of values. Is  most likely positive or negative at x=1.9?
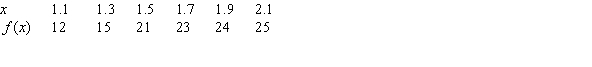
(Multiple Choice)
4.8/5 (48)
To produce 250 items the total cost is $4600 and the marginal cost is $11. Estimate the cost of producing 500 items.
(Short Answer)
4.9/5 (35)
Using a calculator, estimate the derivative of  at x =
  . Make sure your calculator is set to radians.
(Short Answer)
4.7/5 (39)
Cost and revenue functions for a certain chemical manufacturer are given in the following figure. To maximize profit, how many tons should the company produce? 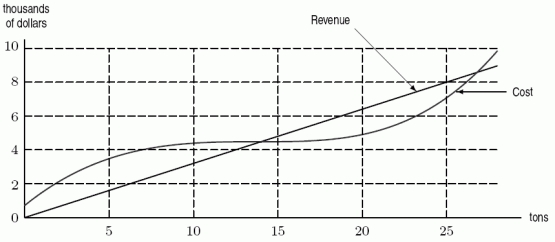
(Multiple Choice)
4.8/5 (42)
Filters
- Essay(0)
- Multiple Choice(0)
- Short Answer(0)
- True False(0)
- Matching(0)