Exam 23: Applying Analytics to Big Data in Operations Management
Exam 1: Operations and Productivity138 Questions
Exam 2: Operations Strategy in a Global Environment134 Questions
Exam 3: Project Management131 Questions
Exam 4: Forecasting148 Questions
Exam 5: Design of Goods and Services126 Questions
Exam 6: Managing Quality226 Questions
Exam 7: Process Strategies259 Questions
Exam 8: Location Strategies233 Questions
Exam 9: Human Resources, Job Design, and Work Measurement321 Questions
Exam 10: Supply Chain Management158 Questions
Exam 11: Inventory Management230 Questions
Exam 12: Aggregate Planning and Sop122 Questions
Exam 13: Material Requirements Planning Mrp and Erp133 Questions
Exam 14: Short-Term Scheduling124 Questions
Exam 15: Lean Operations122 Questions
Exam 16: Maintenance and Reliability119 Questions
Exam 17: Decision-Making Tools101 Questions
Exam 18: Linear Programming102 Questions
Exam 19: Transportation Models92 Questions
Exam 20: Waiting-Line Models126 Questions
Exam 21: Learning Curves114 Questions
Exam 22: Simulation78 Questions
Exam 23: Applying Analytics to Big Data in Operations Management61 Questions
Select questions type
Which of the following Excel functions is NOT used to facilitate quick accuracy checks on the extreme values?
Free
(Multiple Choice)
4.9/5  (32)
(32)
Correct Answer: Verified
C
Digital data can be collected from web sites, credit cards, point-of-sale records, social media, and operational environments.
Free
(True/False)
4.9/5 (39)
Correct Answer:Verified
True
Explain neural networks and machine learning.
Free
(Essay)
4.7/5 (37)
Correct Answer:Verified
Neural networks are computer systems, which, guided by statistical techniques, take large volumes of data and potential variables to form groupings of variables to identify complex paths and associations. Machine learning often builds on these paths and associations to make science fiction a reality by creating speech recognition and self-driving cars. As applied to analytics, machine learning provides a vehicle to sift through vast amounts of big data to provide insight.
________ is an Excel tool to visually identify characteristics of data using formatting.
(Short Answer)
4.8/5 (41)
Which of the following business analytics tools identifies and organizes data into groups with similar attributes?
(Multiple Choice)
4.9/5 (28)
Data completeness refers to the degree to which all required data are present.
(True/False)
4.9/5 (29)
What Excel formula should be used to count the number of empty cells in the following dataset? 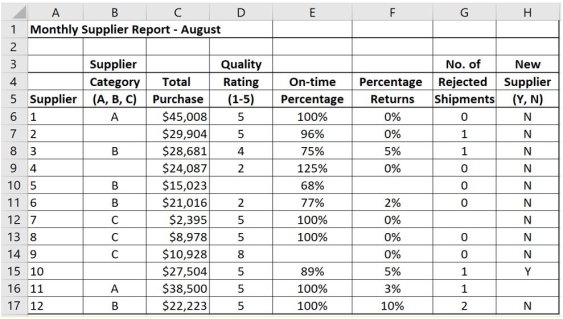
(Multiple Choice)
4.7/5 (29)
Which of the following data visualization graphs uses arcs and nodes to provide a representation of flow through a system?
(Multiple Choice)
4.8/5 (31)
Descriptive analytics characterizes and summarizes data to facilitate understanding.
(True/False)
4.8/5 (24)
Perform a visual inspection on the following dataset. Identify the number of cells that need to be cleaned in Column D. 
(Multiple Choice)
4.9/5 (32)
Which of the following business analytics tools is designed to explore very large datasets, looking for relevant patterns or relationships?
(Multiple Choice)
4.9/5 (35)
In a ________, the highest and lowest values are highlighted.
(Multiple Choice)
4.7/5 (39)
Which of the following data visualization graphs illustrates relative increases or decreases of categories in time or at points of comparison?
(Multiple Choice)
4.7/5 (30)
The huge amount of production, consumer, and social media data collected in digital form is called ________.
(Multiple Choice)
4.9/5 (29)
A ________ in Excel's Conditional Formatting changes the Fill color of every cell by using a gradation of two or three different colors. ________ means more extreme.
(Multiple Choice)
4.9/5 (33)
Speech recognition and self-driving cars are applications of:
(Multiple Choice)
4.8/5 (40)
________ is a tool to facilitate in-depth analysis of numeric data by applying filters and providing summary computations for categories and subcategories of the dataset.
(Multiple Choice)
4.9/5 (28)
Data integrity requires that data be complete, consistent, and abundant.
(True/False)
4.8/5 (30)
Filters
- Essay(0)
- Multiple Choice(0)
- Short Answer(0)
- True False(0)
- Matching(0)