Exam 23: Applying Analytics to Big Data in Operations Management
Exam 1: Operations and Productivity138 Questions
Exam 2: Operations Strategy in a Global Environment134 Questions
Exam 3: Project Management131 Questions
Exam 4: Forecasting148 Questions
Exam 5: Design of Goods and Services126 Questions
Exam 6: Managing Quality226 Questions
Exam 7: Process Strategies259 Questions
Exam 8: Location Strategies233 Questions
Exam 9: Human Resources, Job Design, and Work Measurement321 Questions
Exam 10: Supply Chain Management158 Questions
Exam 11: Inventory Management230 Questions
Exam 12: Aggregate Planning and Sop122 Questions
Exam 13: Material Requirements Planning Mrp and Erp133 Questions
Exam 14: Short-Term Scheduling124 Questions
Exam 15: Lean Operations122 Questions
Exam 16: Maintenance and Reliability119 Questions
Exam 17: Decision-Making Tools101 Questions
Exam 18: Linear Programming102 Questions
Exam 19: Transportation Models92 Questions
Exam 20: Waiting-Line Models126 Questions
Exam 21: Learning Curves114 Questions
Exam 22: Simulation78 Questions
Exam 23: Applying Analytics to Big Data in Operations Management61 Questions
Select questions type
Which of the following business analytics tools take(s) large volumes of data and potential variables to form groupings of variables to identify complex paths and associations?
(Multiple Choice)
4.8/5  (33)
(33)
Data consistency refers to the degree of conformity of a measure to a standard value.
(True/False)
4.9/5 (37)
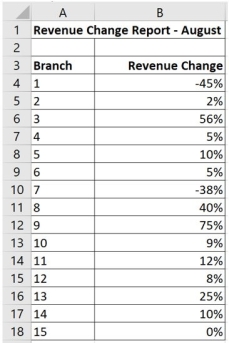
An analytics manager, Carole, is reviewing the performance data of fifteen branch stores. She wants to create a heat map using the color scale Green-White-Red.
a. Help Carole create the color map. What steps are required?
b. What color will Branch 1's cell be? Branch 9's cell?
(Essay)
4.7/5 (34)
An analytics manager, Lauren, is reviewing the performance data of fifteen branch stores. She wants to create a heat map with symbols as in the figure below. What tool should she use? 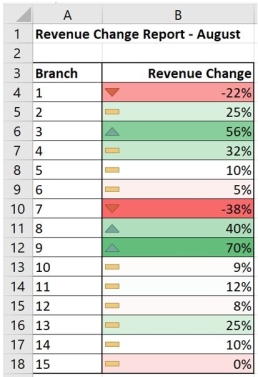
(Multiple Choice)
4.8/5 (33)
Which of the following is NOT one of the four categories (areas) to click-and-drag fields into when using the PivotTable function?
(Multiple Choice)
4.7/5 (33)
What tool does UPS use to analyze more than 1 billion data points each day?
(Multiple Choice)
4.8/5 (37)
Data management is about using tools and techniques to convert data into summary information and business insights for decision making.
(True/False)
4.8/5 (34)
The management task with business analytics is all about gathering as much data as possible.
(True/False)
4.8/5 (34)
An analytics manager, Mark, highlighted all empty cells using Excel's Conditional Formatting tool for the following dataset. What steps did he take? 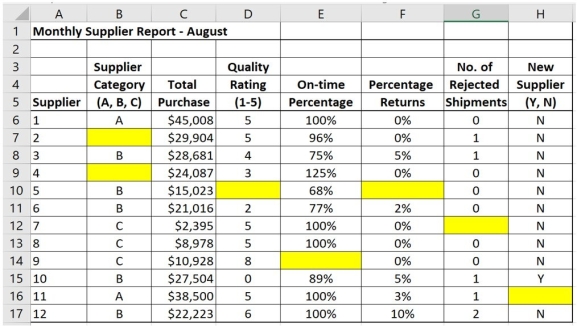
(Multiple Choice)
4.8/5 (39)
The three categories of analytics are ________, ________, and ________.
(Short Answer)
4.8/5 (42)
It is impossible to include more than one field in the Rows area or the Columns area in a PivotTable.
(True/False)
4.8/5 (42)
An analytics manager, Lawrence, wants to clean the following dataset using Excel's Conditional Formatting tool. What steps should he take if he wants to make sure that any suppliers that have more than 8% returns should not receive a quality rating of 5? Highlight those cells using red. 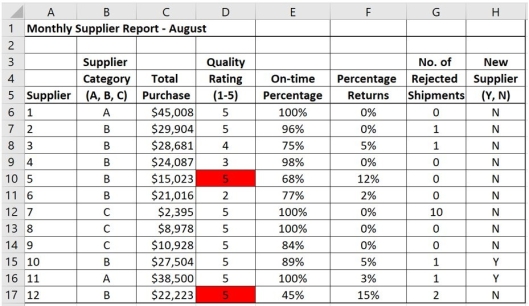
(Multiple Choice)
4.7/5 (28)
An analytics manager, Petra, wants to clean the following dataset using Excel's Conditional Formatting tool. What steps should she take if she wants to highlight any percentages in Column E that are not between 0% and 100% using a light blue color? 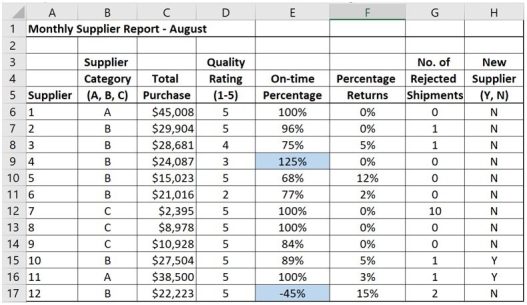
(Multiple Choice)
4.8/5 (33)
Data can be stored three ways: ________, ________, or ________.
(Short Answer)
4.9/5 (38)
Data collection is so massive that it is now measured in megabytes.
(True/False)
4.9/5 (34)
Which of the following data visualization graphs represents percentages or portions of a whole?
(Multiple Choice)
4.9/5 (29)
Filters
- Essay(0)
- Multiple Choice(0)
- Short Answer(0)
- True False(0)
- Matching(0)