Exam 2: Descriptive Statistics I: Elementary Data Presentation and Description
Exam 1: An Introduction to Statistics44 Questions
Exam 2: Descriptive Statistics I: Elementary Data Presentation and Description147 Questions
Exam 3: Descriptive Statistics II: Additional Descriptive Measures and Data Displays128 Questions
Exam 4: Probability147 Questions
Exam 5: Discrete Probability Distributions144 Questions
Exam 6: Continuous Probability Distributions141 Questions
Exam 7: Statistical Inference: Estimating a Population Mean134 Questions
Exam 8: Interval Estimates for Proportions, Mean Differences and Proportion Differences19 Questions
Exam 9: Statistical Hypothesis Testing: Hypothesis Tests for a Population Mean62 Questions
Exam 10: Hypothesis Tests for Proportions, Mean Differences and Proportion Differences39 Questions
Exam 11: Basic Regression Analysis111 Questions
Exam 12: Multiple Regression53 Questions
Exam 13: F Tests and Analysis of Variance95 Questions
Exam 14: Experimental Designonline Only64 Questions
Exam 16: Chi-Square Tests145 Questions
Select questions type
When working with grouped data, classes should touch but not overlap and classes should be of equal widths.
(True/False)
4.9/5  (36)
(36)
The number of days required per audit for 100 recent audits conducted by the IRS office in Cincinnati is shown in the relative frequency table below.Compute the variance of x, the number of required auditors.Treat the data as a population. 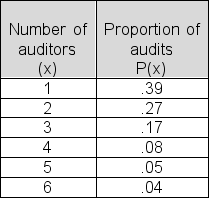
(Multiple Choice)
4.7/5 (40)
In a relative frequency distribution, is substituted for the absolute count f(x) in each class.
(Multiple Choice)
4.8/5 (27)
The table shows the GDP per capita (in US $s) of the G8 countries (Datablog, Guardian.co.uk, July 8 2009).What is the median GDP per capita of the eight countries?
(Multiple Choice)
4.9/5 (41)
Which of the following distribution shapes is one in which the distribution is split into two identical halves?
(Multiple Choice)
4.8/5 (34)
If the variance of a data set is correctly computed with the formula using n - 1 in the denominator, which of the following is true:
(Multiple Choice)
4.8/5 (33)
Which of the following descriptive measures of dispersion is NOT in the same units as the original data?
(Multiple Choice)
4.8/5 (33)
Purchasing agent Angela Rodriguez reported the number of sales calls she received from suppliers on each of the past 14 days.Compute the standard deviation for her daily calls during the 14-day period.Treat the data as a sample. 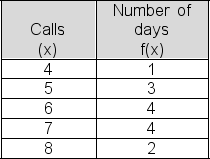
(Multiple Choice)
4.9/5 (31)
Below is a list of shipping costs quoted by six online retailers for the same item.Compute the MAD for the shipping cost data. $3.00 $2.84 $2.40 $3.02 $2.80 $2.51
(Multiple Choice)
4.7/5 (38)
For a sample of 10 days, Harkin Research recorded the number of visitors to Tilton.com's website.Determine the MAD for the data. 100, 100, 106, 93, 89, 95, 97, 181, 99, 100
(Multiple Choice)
5.0/5 (34)
Online customers are asked to score the level of customer service they received at Gregory.com.Scores for 20 recent applicants are given below.Show the data in a frequency table, construct the corresponding bar chart.Describe the shape of the distribution. 9 6 8 9 9 5 6 8 5 6
8 9 7 6 8 9 6 5 6 9
(Multiple Choice)
4.7/5 (31)
Purchasing agent Angela Rodriguez reported the number of sales calls she received from suppliers on each of the past 14 days.What is the median number of calls? 
(Multiple Choice)
4.8/5 (38)
The closing share price for G.E.stock over the past seven days is shown below.Compute the range for this data. 112, 115, 111, 116, 116, 116, 112
(Multiple Choice)
4.8/5 (36)
Atlantic Power and Light tracked daily power surges over the past 500 days.Results are reported in the relative frequency table below.Compute the variance for the number of daily power surges. 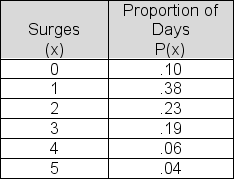
(Multiple Choice)
4.9/5 (36)
In general, when a data set shows positive skewness, the mean will be smaller than the median; for negatively skewed data, the mean will be larger than the median.
(True/False)
4.7/5 (37)
The table shows the life expectancy in years of the G8 countries (Datablog, Guardian.co.uk, July 8 2009).What is the mean life expectancy of the eight countries? 
(Multiple Choice)
4.8/5 (34)
The descriptive measures (mean, variance, and standard deviation) will yield different values for a relative frequency distribution versus a frequency distribution, for the same data set.
(True/False)
4.9/5 (39)
Filters
- Essay(0)
- Multiple Choice(0)
- Short Answer(0)
- True False(0)
- Matching(0)