Exam 2: Descriptive Statistics I: Elementary Data Presentation and Description
Exam 1: An Introduction to Statistics44 Questions
Exam 2: Descriptive Statistics I: Elementary Data Presentation and Description147 Questions
Exam 3: Descriptive Statistics II: Additional Descriptive Measures and Data Displays128 Questions
Exam 4: Probability147 Questions
Exam 5: Discrete Probability Distributions144 Questions
Exam 6: Continuous Probability Distributions141 Questions
Exam 7: Statistical Inference: Estimating a Population Mean134 Questions
Exam 8: Interval Estimates for Proportions, Mean Differences and Proportion Differences19 Questions
Exam 9: Statistical Hypothesis Testing: Hypothesis Tests for a Population Mean62 Questions
Exam 10: Hypothesis Tests for Proportions, Mean Differences and Proportion Differences39 Questions
Exam 11: Basic Regression Analysis111 Questions
Exam 12: Multiple Regression53 Questions
Exam 13: F Tests and Analysis of Variance95 Questions
Exam 14: Experimental Designonline Only64 Questions
Exam 16: Chi-Square Tests145 Questions
Select questions type
Below is a frequency table showing the results of a recent customer survey done at the Mall of America in Minneapolis.Fifty shoppers were asked, "How many times did you visit the Mall last month to shop?" Determine the "less than or equal to" cumulative relative frequency that would be appropriate for an x value of 1 mall visits. 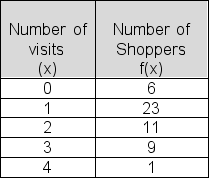
(Multiple Choice)
4.9/5  (33)
(33)
Purchasing agent Angela Rodriguez reported the number of sales calls she received from suppliers each of the past 14 days.Compute the mean number of sales calls she received per day over the 14-day period. 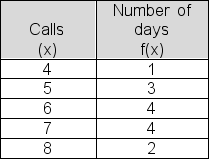
(Multiple Choice)
4.9/5 (36)
The relative frequency table below shows the closing share price changes for the 100 most actively traded NASDAQ stocks yesterday.Use the grouped data table to approximate the mean for the data represented. 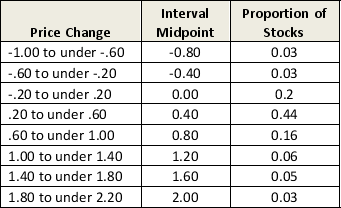
(Multiple Choice)
4.8/5 (32)
In a recent survey, 75 college students were asked how many e-textbooks they are using this term.Survey results are as follows.Compute the mean number of e-textbooks for students in the survey. 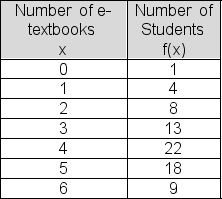
(Multiple Choice)
4.8/5 (31)
The is the measure of dispersion that is NOT expressed in the same units as the mean.
(Multiple Choice)
4.8/5 (36)
The table shows the life expectancy in years of the G8 countries (Datablog, Guardian.co.uk, July 8 2009).Treating the data as a population, what is the variance of life expectancy in the eight countries, in years squared? 
(Multiple Choice)
4.9/5 (40)
The table shows the life expectancy in years of the G8 countries (Datablog, Guardian.co.uk, July 8 2009).What is the median life expectancy of the eight countries? 
(Multiple Choice)
4.8/5 (29)
The median identifies the data set center by establishing a value such that at least half the numbers in the data set are at or above that value and at least half the numbers are at or below.
(True/False)
4.7/5 (29)
In a frequency distribution, x represents the possible values and f(x) represents the counts or frequencies of those values.
(True/False)
4.9/5 (31)
The degree of steepness or peakedness in graph of a frequency or relative frequency distribution is called:
(Multiple Choice)
4.8/5 (33)
The waiting line of cars at In-N-Out Burger on Van Nuys Blvd.can get fairly long.In a recent study, you checked the length of the line 60 random times during one day.The table below shows the full set of results.Determine the "less than or equal to" cumulative frequency for an x value of 4 customers in line. 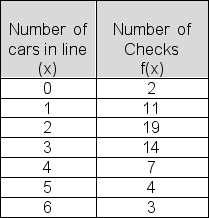
(Multiple Choice)
4.7/5 (29)
The table shows the GDP per capita (in US $s) of the G8 countries (Datablog, Guardian.co.uk, July 8 2009).What is the mean GDP per capita of the eight countries?
(Multiple Choice)
5.0/5 (33)
Below is a list of shipping costs quoted by six online retailers for the same item.Compute the median shipping cost. $3.00 $2.84 $2.40 $3.02 $2.80 $2.51
(Multiple Choice)
4.8/5 (36)
The most frequently occurring value of a data set is called the mode.
(True/False)
4.9/5 (25)
For a sample of 10 days, Harkin Research recorded the number of visitors to Tilton.com's website.Compute the standard deviation for the data.Treat the data as a sample. 100, 100, 106, 93, 89, 95, 97, 181, 99, 100
(Multiple Choice)
4.9/5 (35)
The table below summarizes the prices of the most recent 25 home sales in the Magnolia area.Treating the information as population data, estimate the standard deviation of the price of the most recent 25 homes sold in Magnolia.What is your estimate of the standard deviation, in dollars? 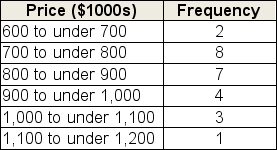
(Multiple Choice)
4.7/5 (38)
Which of the following best describes the mean absolute deviation (MAD):
(Multiple Choice)
4.9/5 (34)
The number of days required per audit for 100 recent audits conducted by the IRS office in Cincinnati is shown in the relative frequency table below.Compute the standard deviation of x, the number of required auditors.Treat the data as a population. 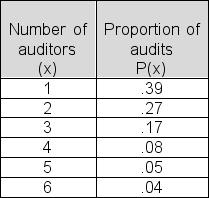
(Multiple Choice)
4.8/5 (30)
Filters
- Essay(0)
- Multiple Choice(0)
- Short Answer(0)
- True False(0)
- Matching(0)