Exam 2: Descriptive Statistics I: Elementary Data Presentation and Description
Exam 1: An Introduction to Statistics44 Questions
Exam 2: Descriptive Statistics I: Elementary Data Presentation and Description147 Questions
Exam 3: Descriptive Statistics II: Additional Descriptive Measures and Data Displays128 Questions
Exam 4: Probability147 Questions
Exam 5: Discrete Probability Distributions144 Questions
Exam 6: Continuous Probability Distributions141 Questions
Exam 7: Statistical Inference: Estimating a Population Mean134 Questions
Exam 8: Interval Estimates for Proportions, Mean Differences and Proportion Differences19 Questions
Exam 9: Statistical Hypothesis Testing: Hypothesis Tests for a Population Mean62 Questions
Exam 10: Hypothesis Tests for Proportions, Mean Differences and Proportion Differences39 Questions
Exam 11: Basic Regression Analysis111 Questions
Exam 12: Multiple Regression53 Questions
Exam 13: F Tests and Analysis of Variance95 Questions
Exam 14: Experimental Designonline Only64 Questions
Exam 16: Chi-Square Tests145 Questions
Select questions type
Carnival Cruise Lines reported the number of passengers (in millions) it served for the past 8 years.Compute the variance for the data.Treat the data as a population. 
(Multiple Choice)
4.7/5  (24)
(24)
A data set consists of 10 values: 9, 6, 2, 0, 2, 3, 5, 2, 1, 5.Determine the mode.
(Multiple Choice)
4.8/5 (27)
When calculating the median of an ordered data set with an odd number of items, the median is the value of the middle item.
(True/False)
4.9/5 (37)
Atlantic Power and Light tracked daily power surges over the past 500 days.Results are reported in the relative frequency table below.Compute the mean number of surges per day. 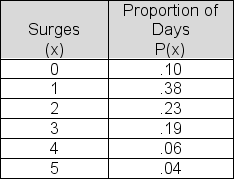
(Multiple Choice)
5.0/5 (36)
Carnival Cruise Lines reported the number of passengers (in millions) it served for the past 8 years.Compute the MAD for the data. 
(Multiple Choice)
4.8/5 (38)
Turcott Roof and Deck has 130 jobs scheduled for the upcoming month.The following frequency table shows the estimated completion time for each of the jobs.Compute the median completion time estimate. 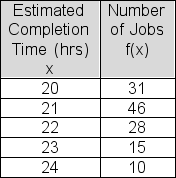
(Multiple Choice)
4.9/5 (30)
The closing share price for G.E.stock over the past seven days is shown below.Compute the MAD for the data. 112, 115, 111, 116, 116, 116, 112
(Multiple Choice)
4.7/5 (34)
The table shows the life expectancy in years of the G8 countries (Datablog, Guardian.co.uk, July 8 2009).What is the range of life expectancy in the eight countries? 
(Multiple Choice)
4.9/5 (34)
The number of days required per audit for 100 recent audits conducted by the IRS office in Cincinnati is shown in the relative frequency table below.Determine the median number of required auditors per job. 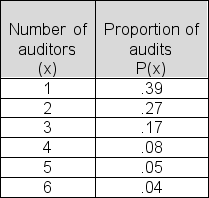
(Multiple Choice)
4.8/5 (33)
Turcott Roof and Deck has 130 jobs scheduled for the upcoming month.The following frequency table shows the estimated completion time for each of the jobs.Construct the frequency bar chart for the data and describe its shape. 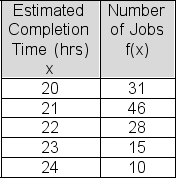
(Multiple Choice)
4.9/5 (30)
A tabular summary of a set of data showing the proportion of the total number of items in several non-overlapping classes is a:
(Multiple Choice)
4.9/5 (30)
The most frequently occurring value of a data set is called the mean.
(True/False)
4.9/5 (49)
The number of auditors required for 200 recent audits conducted by the IRS office in Cincinnati is shown in the relative frequency table below.Compute the mean number of auditors per audit. 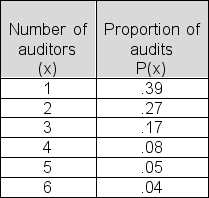
(Multiple Choice)
4.8/5 (35)
Since the population size is always larger than the sample size, a sample statistic can never be larger than the population parameter.
(True/False)
4.9/5 (37)
Over the past 30 days, Kim recorded the number of hours that she slept each night.The frequency table below summarizes her sleep habits.Treating the data as a sample, what is the variance of Kim's nightly hours of sleep, in hours squared? 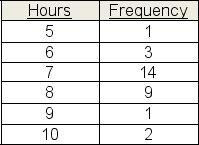
(Multiple Choice)
4.9/5 (42)
Below is a frequency distribution table showing the number of cars sold by the 30 sales reps at Hermiston Kia during the past month.You plan to show the data in a "less than or equal to" cumulative relative frequency table.What cumulative frequency would you show for 2 cars? 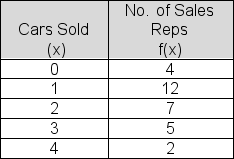
(Multiple Choice)
4.8/5 (34)
The age distribution of consumers who identify themselves as "frequent users" of the Internet to make purchases is shown in the table.Estimate the variance of frequent user ages.Treat the data as from a population. 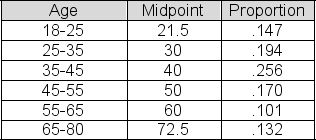
(Multiple Choice)
4.9/5 (39)
The relative frequency of a class is the proportion of the number of members in that class.
(True/False)
4.9/5 (35)
Test scores for 40 job applicants at Briar and Flanagan are reported in the table below.Suppose you intend to show the values in a grouped data relative frequency table, using the intervals 30 to under 40, 40 to under 50, 50 to under 60, and so on.What's the frequency value that you should enter in the table for the interval "60 to under 70"? 
(Multiple Choice)
4.8/5 (37)
The standard deviation is approximately the average distance between the individual values in the data set and the data set center (i.e., the mean).
(True/False)
4.9/5 (38)
Filters
- Essay(0)
- Multiple Choice(0)
- Short Answer(0)
- True False(0)
- Matching(0)