Exam 2: Descriptive Statistics I: Elementary Data Presentation and Description
Exam 1: An Introduction to Statistics44 Questions
Exam 2: Descriptive Statistics I: Elementary Data Presentation and Description147 Questions
Exam 3: Descriptive Statistics II: Additional Descriptive Measures and Data Displays128 Questions
Exam 4: Probability147 Questions
Exam 5: Discrete Probability Distributions144 Questions
Exam 6: Continuous Probability Distributions141 Questions
Exam 7: Statistical Inference: Estimating a Population Mean134 Questions
Exam 8: Interval Estimates for Proportions, Mean Differences and Proportion Differences19 Questions
Exam 9: Statistical Hypothesis Testing: Hypothesis Tests for a Population Mean62 Questions
Exam 10: Hypothesis Tests for Proportions, Mean Differences and Proportion Differences39 Questions
Exam 11: Basic Regression Analysis111 Questions
Exam 12: Multiple Regression53 Questions
Exam 13: F Tests and Analysis of Variance95 Questions
Exam 14: Experimental Designonline Only64 Questions
Exam 16: Chi-Square Tests145 Questions
Select questions type
Below is a list of shipping costs quoted by six online retailers for the same item.Compute the variance of the shipping cost data.Treat the data as a population. $3.00 $2.84 $2.40 $3.02 $2.80 $2.51
(Multiple Choice)
4.9/5  (36)
(36)
For a sample of 10 days, Harkin Research recorded the number of visitors to Tilton.com's website.Compute the mean number of visitors per day. 100, 100, 106, 93, 89, 95, 97, 181, 99, 100
(Multiple Choice)
4.8/5 (34)
When looking at the shape of a distribution, which of the following best describes positive skewness?
(Multiple Choice)
4.9/5 (29)
The following chart gives the number of full years served by the first 42 presidents of the United States (up to and including George W.Bush).What is the standard deviation of full years served by the first 42 presidents of the United States? Remember that this includes all of the presidents. 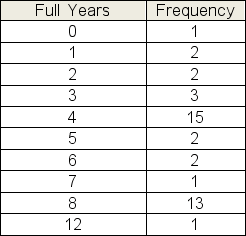
(Multiple Choice)
4.9/5 (33)
Below is a frequency table showing the number of new restaurants opened in the city over the past 24 months.Compute the mean number of openings per month over this 24-month period. 
(Multiple Choice)
4.8/5 (30)
The relative frequency table below shows the closing share price changes for the 100 most actively traded NASDAQ stocks yesterday.Use the grouped data table to approximate the variance for the data represented. 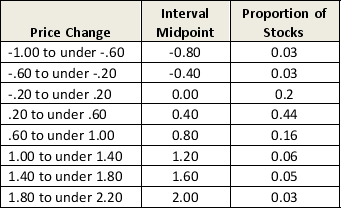
(Multiple Choice)
4.8/5 (36)
A data set consists of 10 values: 9, 6, 2, 0, 2, 3, 5, 2, 1, 5.Determine the median.
(Multiple Choice)
4.8/5 (26)
In a recent survey, 75 college students were asked how many e-textbooks they are using this term.Survey results are as follows.Compute the median number of e-textbooks for students in the survey. 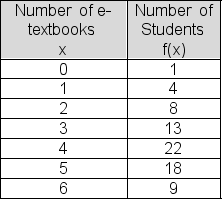
(Multiple Choice)
4.8/5 (41)
Over the past 30 days, Kim recorded the number of hours that she slept each night.The frequency table below summarizes her sleep habits.What is the median number of hours Kim slept each night? 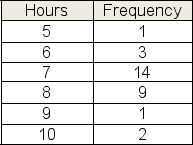
(Multiple Choice)
4.9/5 (34)
The number of US solar energy companies that applied for special tax credits in each of the past 11 months, according to a recent study, is shown below.Determine the mode for the data. 14, 17, 12, 11, 17, 20, 11, 12, 15, 17, 20
(Multiple Choice)
4.9/5 (33)
Below is a frequency table showing the number of new restaurants opened in the city over the past 24 months.What is the median number of openings per month over this 24-month period. 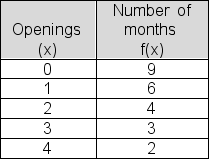
(Multiple Choice)
4.8/5 (35)
The sample variance has the value n in the denominator while the population variance has the value n-1 in the denominator.
(True/False)
4.8/5 (35)
The main difference between a bar graph and a histogram is that the bars are separated in a histogram to emphasize the fact that each class is a separate category.
(True/False)
4.7/5 (39)
If there are an odd number of items in a data set, the median is the average of the values of the two middle items.
(True/False)
4.9/5 (38)
A data set consists of 10 values: 9, 6, 2, 0, 2, 3, 5, 2, 1, 5.Determine the mean.
(Multiple Choice)
4.9/5 (28)
A data set contains only two values.One of the two values is 64.If the MAD is 9, what is the standard deviation for this data set?
(Multiple Choice)
4.8/5 (38)
In a bar chart, the height of the vertical bar represents the x value.
(True/False)
4.8/5 (38)
The mean absolute deviation (MAD) measures the average absolute distance of data points from the mean of the data set.
(True/False)
4.8/5 (39)
Below is a table showing the ages of current active users of FaceTime.com.Use the table to approximate the variance of user ages. 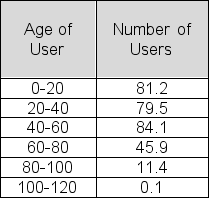
(Multiple Choice)
4.8/5 (41)
Filters
- Essay(0)
- Multiple Choice(0)
- Short Answer(0)
- True False(0)
- Matching(0)