Exam 2: Descriptive Statistics I: Elementary Data Presentation and Description
Exam 1: An Introduction to Statistics44 Questions
Exam 2: Descriptive Statistics I: Elementary Data Presentation and Description147 Questions
Exam 3: Descriptive Statistics II: Additional Descriptive Measures and Data Displays128 Questions
Exam 4: Probability147 Questions
Exam 5: Discrete Probability Distributions144 Questions
Exam 6: Continuous Probability Distributions141 Questions
Exam 7: Statistical Inference: Estimating a Population Mean134 Questions
Exam 8: Interval Estimates for Proportions, Mean Differences and Proportion Differences19 Questions
Exam 9: Statistical Hypothesis Testing: Hypothesis Tests for a Population Mean62 Questions
Exam 10: Hypothesis Tests for Proportions, Mean Differences and Proportion Differences39 Questions
Exam 11: Basic Regression Analysis111 Questions
Exam 12: Multiple Regression53 Questions
Exam 13: F Tests and Analysis of Variance95 Questions
Exam 14: Experimental Designonline Only64 Questions
Exam 16: Chi-Square Tests145 Questions
Select questions type
The table shows the life expectancy in years of the G8 countries (Datablog, Guardian.co.uk, July 8 2009).What is the mode of life expectancy in the eight countries? 
(Multiple Choice)
4.9/5  (35)
(35)
Below is a table showing the number of cancelled flights for Alleghany Airlines over the past 25 days.If you were to construct a "less than or equal to" cumulative frequency table what value would you enter as the cumulative frequency associated with 3 cancellations? 
(Multiple Choice)
4.9/5 (34)
On the horizontal axis of a bar chart, one places the frequency or the relative frequency (but only one).
(True/False)
4.7/5 (38)
The waiting line of cars at In-N-Out Burger on Van Nuys Blvd.can get fairly long.In a recent study, you checked the length of the line 60 random times during one day.The table below shows the full set of results.Determine the "less than or equal to" cumulative relative frequency for an x value of 3 customers in line. 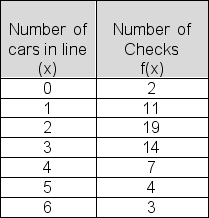
(Multiple Choice)
4.8/5 (31)
If a distribution has a shape that is positively skewed, this means that it has an elongated tail that extends in the right-hand direction.
(True/False)
4.7/5 (33)
Below is a frequency table showing the number of new restaurants opened in the city over the past 24 months.Compute the variance of the number of openings data.Treat the data as a population. 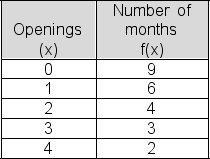
(Multiple Choice)
4.7/5 (28)
Filters
- Essay(0)
- Multiple Choice(0)
- Short Answer(0)
- True False(0)
- Matching(0)