Exam 2: Descriptive Statistics I: Elementary Data Presentation and Description
Exam 1: An Introduction to Statistics44 Questions
Exam 2: Descriptive Statistics I: Elementary Data Presentation and Description147 Questions
Exam 3: Descriptive Statistics II: Additional Descriptive Measures and Data Displays128 Questions
Exam 4: Probability147 Questions
Exam 5: Discrete Probability Distributions144 Questions
Exam 6: Continuous Probability Distributions141 Questions
Exam 7: Statistical Inference: Estimating a Population Mean134 Questions
Exam 8: Interval Estimates for Proportions, Mean Differences and Proportion Differences19 Questions
Exam 9: Statistical Hypothesis Testing: Hypothesis Tests for a Population Mean62 Questions
Exam 10: Hypothesis Tests for Proportions, Mean Differences and Proportion Differences39 Questions
Exam 11: Basic Regression Analysis111 Questions
Exam 12: Multiple Regression53 Questions
Exam 13: F Tests and Analysis of Variance95 Questions
Exam 14: Experimental Designonline Only64 Questions
Exam 16: Chi-Square Tests145 Questions
Select questions type
Summaries of data, which may be tabular, graphical, or numerical, are referred to as:
(Multiple Choice)
4.8/5  (36)
(36)
On a recent biology quiz, about 90 percent of students earned excellent scores, but the other 10 percent did very poorly.The shape of the distribution of quiz scores is best described as:
(Multiple Choice)
4.7/5 (39)
A data display that shows the number of data set members that are at or below a particular value or the number of data set members that are at or above a particular value is called a ___________ distribution.
(Multiple Choice)
5.0/5 (25)
The total number of data items with a value less than or equal to the upper limit for the class is given by the:
(Multiple Choice)
4.9/5 (32)
In a cumulative frequency distribution, we can show directly the number of data set members at or below any specified value.
(True/False)
4.9/5 (32)
In a bar chart, is indicated by an elongated tail in the left-hand direction.
(Multiple Choice)
4.9/5 (37)
Purchasing agent Angela Rodriguez reported the number of sales calls she received from suppliers on each of the past 14 days.Compute the variance for her daily calls during the 14-day period.Treat the data as a sample. 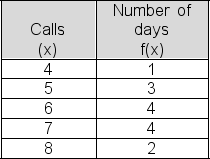
(Multiple Choice)
4.8/5 (42)
The following chart gives the number of full years served by the first 42 presidents of the United States (up to and including George W.Bush).What is the average number of full years served by the first 42 presidents of the United States? 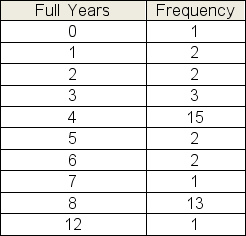
(Multiple Choice)
4.7/5 (34)
Test scores for 40 job applicants at Briar and Flanagan are reported in the table below.Suppose you intend to show the values in a grouped data relative frequency table, using the intervals 30 to under 40, 40 to under 50, 50 to under 60, and so on.What's the relative frequency value that you should enter in the table for the interval "70 to under 80"? 
(Multiple Choice)
4.7/5 (31)
Over the past month, Kim recorded the number of hours she slept each night.The frequency table below summarizes her sleep habits.What is the average number of hours Kim slept each night? 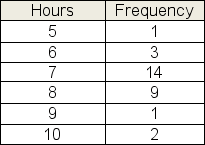
(Multiple Choice)
4.8/5 (28)
For a sample of 10 days, Harkin Research recorded the number of visitors to Tilton.com's website.Determine the variance for the data.Treat the data as a sample. 100, 100, 106, 93, 89, 95, 97, 181, 99, 100
(Multiple Choice)
4.9/5 (24)
When should measures of location and dispersion be computed from grouped data rather than from individual data values?
(Multiple Choice)
4.7/5 (28)
When calculating the mean for grouped data, which of the following is used for the weights in the formula:
(Multiple Choice)
4.7/5 (34)
Below is a table showing the ages of current active users of FaceTime.com.Use the table to approximate the standard deviation of user ages. 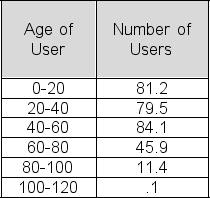
(Multiple Choice)
4.9/5 (33)
The term ______ describes the shape of a distribution of values when the distribution has two peaks.
(Multiple Choice)
4.8/5 (31)
For a sample of 10 days, Harkin Research recorded the number of visitors to Tilton.com's website.Determine the median value for the data. 100, 100, 106, 93, 89, 95, 97, 181, 99, 100
(Multiple Choice)
4.8/5 (29)
The closing share price for G.E.stock over the past seven days is shown below.Compute the variance for the data.Treat the data as a population. 112, 115, 111, 116, 116, 116, 112
(Multiple Choice)
4.8/5 (38)
The is the measure of central tendency that is most affected by very large or very small data values.
(Multiple Choice)
4.9/5 (39)
The number of US solar energy companies that applied for special tax credits in each of the past 11 months, according to a recent study, is shown below.Determine the mean for the data. 14, 17, 12, 11, 17, 20, 11, 12, 15, 17, 20
(Multiple Choice)
4.9/5 (35)
Filters
- Essay(0)
- Multiple Choice(0)
- Short Answer(0)
- True False(0)
- Matching(0)