Exam 53: Introduction to Ecology: Population Ecology
Exam 1: A View of Life88 Questions
Exam 2: Atoms and Molecules: the Chemical Basis of Life85 Questions
Exam 3: The Chemistry of Life: Organic Compounds95 Questions
Exam 4: Organization of the Cell68 Questions
Exam 5: Biological Membranes77 Questions
Exam 6: Cell Communication73 Questions
Exam 7: Energy and Metabolism76 Questions
Exam 8: How Cells Make Atp: Energy-Releasing Pathways90 Questions
Exam 9: Photosynthesis: Capturing Light Energy80 Questions
Exam 10: Chromosomes, Mitosis, and Meiosis91 Questions
Exam 11: The Basic Principles of Heredity75 Questions
Exam 12: Dna: the Carrier of Genetic Information80 Questions
Exam 13: Gene Expression76 Questions
Exam 14: Gene Regulation77 Questions
Exam 15: Dna Technology and Genomics79 Questions
Exam 16: Human Genetics and the Human Genome78 Questions
Exam 17: Developmental Genetics79 Questions
Exam 18: Introduction to Darwinian Evolution70 Questions
Exam 19: Evolutionary Change in Populations79 Questions
Exam 20: Speciation and Macroevolution91 Questions
Exam 21: The Origin and Evolutionary History of Life89 Questions
Exam 22: The Evolution of Primates87 Questions
Exam 23: Understanding Diversity: Systematics79 Questions
Exam 24: Viruses and Subviral Agents41 Questions
Exam 25: Bacteria and Archaea55 Questions
Exam 26: Protists92 Questions
Exam 27: Seedless Plants80 Questions
Exam 28: Seed Plants78 Questions
Exam 29: The Fungi87 Questions
Exam 30: An Introduction to Animal Diversity79 Questions
Exam 31: Sponges, Cnidarians, Ctenophores, and Protostomes146 Questions
Exam 32: The Deuterostomes90 Questions
Exam 33: Plant Structure, Growth, and Development86 Questions
Exam 34: Leaf Structure and Function76 Questions
Exam 35: Stem Structure and Transport74 Questions
Exam 36: Roots and Mineral Nutrition84 Questions
Exam 37: Reproduction in Flowering Plants89 Questions
Exam 38: Plant Developmental Responses to External and Internal Signals95 Questions
Exam 39: Animal Structure and Function: an Introduction96 Questions
Exam 40: Protection, Support, and Movement101 Questions
Exam 41: Neural Signaling87 Questions
Exam 42: Neural Regulation88 Questions
Exam 43: Sensory Systems111 Questions
Exam 44: Internal Transport104 Questions
Exam 45: The Immune System: Internal Defense85 Questions
Exam 46: Gas Exchange109 Questions
Exam 47: Processing Food and Nutrition119 Questions
Exam 48: Osmoregulation and Disposal of Metabolic Wastes94 Questions
Exam 49: Endocrine Regulation82 Questions
Exam 50: Reproduction104 Questions
Exam 51: Animal Development98 Questions
Exam 52: Animal Behavior77 Questions
Exam 53: Introduction to Ecology: Population Ecology97 Questions
Exam 54: Community Ecology74 Questions
Exam 55: Ecosystems and the Biosphere88 Questions
Exam 56: Ecology and the Geography of Life105 Questions
Exam 57: Biological Diversity and Conservation Biology66 Questions
Select questions type
MATCHING
Match the term in a growth rate equation with its definition.
a.b
e.K
b.d
f.N
c.e
g.r
d.i
-equal to the birth rate minus the death rate
(Essay)
4.7/5  (34)
(34)
Figure 53-4
Use the figure to answer the corresponding question(s). 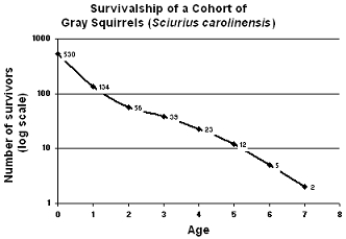 -Based on Figure 53-4, which of the following age intervals has the highest death rate?
(Multiple Choice)
4.7/5 (37)
Figure 53-6
Use the figure to answer the corresponding question(s). 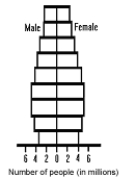 -If the pattern remains the same, in 50 years the population in Figure 53-6 would:
(Multiple Choice)
4.8/5 (42)
By the end of the 21st century, it is expected that the human population will:
(Multiple Choice)
4.8/5 (37)
Figure 53-2
Use the figure to answer the corresponding question(s). 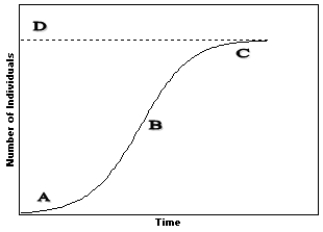 -Using Figure 53-2, identify the point that indicates the carrying capacity for this population.
(Multiple Choice)
4.9/5 (37)
MATCHING
Match the term in a growth rate equation with its definition.
a.b
e.K
b.d
f.N
c.e
g.r
d.i
-rate at which individuals leave a population
(Essay)
4.7/5 (44)
The percentages of a population at different ages are known as the:
(Multiple Choice)
4.9/5 (33)
Which of the following sets of values would result in a population with a growth rate of zero?
(Multiple Choice)
4.9/5 (28)
MATCHING
Match the term in a growth rate equation with its definition.
a.b
e.K
b.d
f.N
c.e
g.r
d.i
-carrying capacity of the environment
(Essay)
4.9/5 (30)
Figure 53-6
Use the figure to answer the corresponding question(s).
-Figure 53-6 represents the age structure diagram of:
(Multiple Choice)
4.8/5 (39)
MATCHING
Match the term in a growth rate equation with its definition.
a.b
e.K
b.d
f.N
c.e
g.r
d.i
-the logistic curve flattens out here
(Essay)
4.8/5 (37)
Members of a(n) r-selected species typically have a short lifespan.
____________________
(True/False)
4.8/5 (35)
Figure 53-2
Use the figure to answer the corresponding question(s).
-Refer to Figure 53-2.At which point on the graph is the population increasing exponentially?
(Multiple Choice)
4.8/5 (42)
Figure 53-1
Use the figure to answer the corresponding question(s). 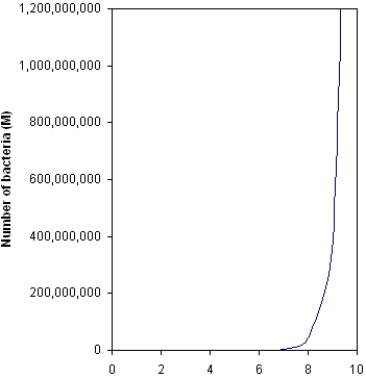 -The graph in Figure 53-1 would best be described as:
(Multiple Choice)
4.8/5 (31)
Most insects and invertebrates are said to be iteroparous.
____________________
(True/False)
4.8/5 (37)
The term referring to the rate at which organisms produce offspring is:
(Multiple Choice)
4.8/5 (26)
Features that are typical of K-selected organisms include all of the following except:
(Multiple Choice)
4.8/5 (39)
Filters
- Essay(0)
- Multiple Choice(0)
- Short Answer(0)
- True False(0)
- Matching(0)