Exam 10: The Tools of Quality
Exam 1: Differing Perspectives on Quality111 Questions
Exam 2: Quality Theory101 Questions
Exam 3: Global Supply Chain Quality and International Quality Standards103 Questions
Exam 4: Strategic Quality Planning104 Questions
Exam 5: The Voice of the Customer100 Questions
Exam 6: The Voice of the Market102 Questions
Exam 7: Quality and Innovation in Product and Process Design101 Questions
Exam 8: Designing Quality Services104 Questions
Exam 9: Managing Supplier Quality in the Supply Chain77 Questions
Exam 10: The Tools of Quality98 Questions
Exam 11: Statistically Based Quality Improvement for Variables100 Questions
Exam 12: Statistically Based Quality Improvement for Attributes101 Questions
Exam 13: Six Sigma Management and Lean Tools101 Questions
Exam 14: Managing Quality Improvement Teams and Projects101 Questions
Exam 15: Implementing and Validating the Quality System96 Questions
Select questions type
The ________ is used to move to lower levels of abstraction in solving problems.
(Multiple Choice)
5.0/5  (39)
(39)
The activity network diagram is also known as a PERT diagram or critical-path diagram and is used in controlling projects.
(True/False)
4.8/5 (31)
Check sheets are data-gathering tools that can be used in forming ________.
(Multiple Choice)
4.8/5 (46)
In a process map, a parallelogram appears whenever materials, forms, or tools enter or leave the process.
(True/False)
4.7/5 (36)
The RC and More Superstore decides to track customer complaints as part of their ongoing customer satisfaction improvement program. After collecting data for two months, their check sheet appears as follows:  If they construct a Pareto chart, what is the cumulative percentage of the two left most bars?
(Multiple Choice)
5.0/5 (35)
The RC and More Superstore decides to track customer complaints as part of their ongoing customer satisfaction improvement program. After collecting data for two months, their check sheet appears as follows: 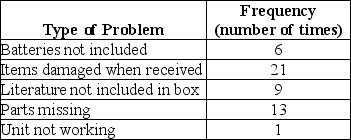 If they construct a Pareto chart, what is the percentage of complaints represented by the problem "Literature not included in box"?
(Multiple Choice)
4.9/5 (32)
Calculate the number of classes if there are 65 observations in a data set.
(Multiple Choice)
4.9/5 (36)
Define a matrix diagram. What are the steps involved in constructing a matrix diagram?
(Essay)
4.8/5 (35)
Cletus Inc. plans to overhaul the cafeteria menu and has formed a four-person team to evaluate alternatives. The team identifies four criteria and their corresponding percentage weights. Option A has ranks as shown in the table below: 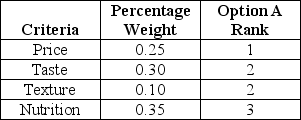 What is the importance score sum for option A?
(Multiple Choice)
4.9/5 (48)
The first step in setting up a check sheet is to identify common defects occurring in the process.
(True/False)
4.8/5 (30)
Control charts are used to determine whether a process will produce a product or service with consistent measurable properties.
(True/False)
4.8/5 (36)
________ are used to identify and prioritize problems to be solved.
(Multiple Choice)
4.9/5 (39)
________ are simply graphical representations of data in a bar format.
(Multiple Choice)
4.7/5 (29)
The RC and More Superstore decides to track customer complaints as part of their ongoing customer satisfaction improvement program. After collecting data for two months, their check sheet appears as follows: 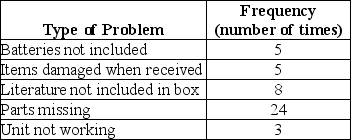 If they construct a Pareto chart, what is the percentage of complaints represented by the problem "Unit not working"?
(Multiple Choice)
4.8/5 (37)
A dashboard quickly communicates performance levels by reflecting the metrics reported in balanced scorecards.
(True/False)
4.9/5 (34)
The cause-and-effect diagram is used to move to higher levels of abstraction in solving problems.
(True/False)
5.0/5 (48)
Filters
- Essay(0)
- Multiple Choice(0)
- Short Answer(0)
- True False(0)
- Matching(0)