Exam 1: Functions and Models
Exam 1: Functions and Models112 Questions
Exam 2: Limits and Derivatives76 Questions
Exam 3: Differentiation Rules75 Questions
Exam 4: Applications of Differentiation77 Questions
Exam 5: Integrals60 Questions
Exam 6: Applications of Integration78 Questions
Exam 7: Techniques of Integration79 Questions
Exam 8: Further Applications of Integration59 Questions
Exam 9: Differential Equations60 Questions
Exam 10: Parametric Equations and Polar Coordinates60 Questions
Exam 11: Infinite Sequences and Series60 Questions
Exam 12: Vectors and the Geometry of Space54 Questions
Exam 13: Vector Functions58 Questions
Exam 14: Partial Derivatives39 Questions
Exam 15: Multiple Integrals60 Questions
Exam 16: Vector Calculus59 Questions
Exam 17: Second-Order Differential Equations60 Questions
Select questions type
The graph shown gives the weight of a certain person as a function of age.Find the age at which the person started an exercise program. 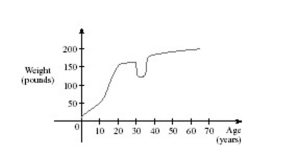
(Multiple Choice)
4.9/5  (28)
(28)
Graph the function by hand, not by plotting points, but by starting with the graph of one of the standard functions and then applying the appropriate transformations.
(Multiple Choice)
4.9/5 (40)
Determine whether the function whose graph is given is even, odd, or neither. 
(Short Answer)
4.8/5 (30)
If the point is on the graph of an even function, what other point must also be on the graph? Select the correct answer.
(Multiple Choice)
4.9/5 (41)
It makes sense that the larger the area of a region, the larger the number of species that inhabit the region. Many ecologists have modeled the species-area relation with a power function and, in particular, the number of species of bats living in caves in central Mexico has been related to the surface area measured in of the caves by the equation
(a) The cave called mission impossible near puebla, mexico, has suface area of . How many species of bats would expect to find in that cave?
(b) If you discover that 5 species of bats live in cave estimate the area of the cave.
(Short Answer)
4.7/5 (34)
A cardiac monitor is used to measure the heart rate of a patient after surgery. It compiles the number of heartbeats after minutes. When the data in the table are graphed, the slope of the tangent line represents the heart rate in beats per minute. The monitor estimates this value by calculating the slope of a secant line. Use the data to estimate the patient's heart rate after 42 minutes using the secant line between the points with and .
t (mins) 36 38 40 42 44 Heartbeats 2570 2720 2840 3020 3070
Select the correct answer.
(Multiple Choice)
4.8/5 (33)
Define the function at 0 so as to make it continuous at 0 .
(Multiple Choice)
4.7/5 (40)
Is there a number such that exists? If so, find the value of and the value of the limit.
(Short Answer)
5.0/5 (36)
Use the graph to determine where the function is discontinuous. 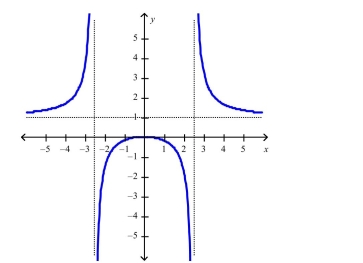
(Short Answer)
4.9/5 (42)
Find , such that the function has the domain .
Select the correct answer.
(Multiple Choice)
4.8/5 (39)
Filters
- Essay(0)
- Multiple Choice(0)
- Short Answer(0)
- True False(0)
- Matching(0)