Exam 6: Random Variables and Probability Distributions
Exam 1: Collecting Data in Reasonable Ways44 Questions
Exam 2: Graphical Methods for Describing Data Distributions33 Questions
Exam 3: Numerical Methods for Describing Data Distributions32 Questions
Exam 4: Describing Bivariate Numerical Data33 Questions
Exam 5: Probability45 Questions
Exam 6: Random Variables and Probability Distributions57 Questions
Exam 7: Selecting an Appropriate Method4 Questions
Exam 8: Sampling Variability Sampling25 Questions
Exam 9: Estimation Using a Single Sample29 Questions
Exam 10: Asking and Answering Questions About a Population Proportion37 Questions
Exam 11: Asking and Answering Questions About the Difference Between Two Population Proportions22 Questions
Exam 12: Asking and Answering Questions About a Population Mean38 Questions
Exam 13: Asking and Answering Questions About the Difference Between Two Means27 Questions
Exam 14: Learning From Experiment Data8 Questions
Select questions type
The density curve for a continuous random variable is shown below. Use this curve
to find the following probabilities: 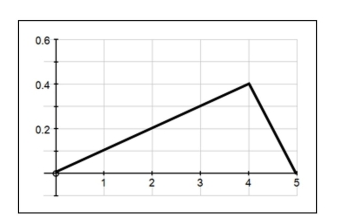 a)
b) P ( 2 < x < 4 )
You may need to use the following area formulas in your calculations:
Area of a rectangle:
Area of a trapezoid:
Area of a right triangle:
a)
b) P ( 2 < x < 4 )
You may need to use the following area formulas in your calculations:
Area of a rectangle:
Area of a trapezoid:
Area of a right triangle:
(Short Answer)
4.8/5  (42)
(42)
Each course at a large university has either a final exam or a final paper. The table
below presents the distribution of the number of final exams that students at the
university take in the Fall term, and their associated probabilities. What is the mean
of this distribution? 1 2 3 ( )
(Essay)
4.7/5 (28)
Let z denote a random variable having a standard normal distribution. Determine each
of the following probabilities. a)
b)
c)
d)
(Essay)
4.7/5 (34)
A gasoline tank for a certain model car is designed to hold 12 gallons of gas. Suppose
that the actual capacity of gas tanks in cars of this type is well approximated by a
normal distribution with mean 12.0 gallons and standard deviation 0.2 gallons. What
is the approximate probability that a randomly selected car of this model will have a
gas tank that holds at most 11.7 gallons?
(Essay)
4.8/5 (33)
What information about a probability distribution do the mean and standard deviation
of a random variable provide?
(Essay)
4.7/5 (39)
For a variable z that has a standard normal distribution, a) What is the probability that ?
b) What is the probability that ?
c) What is the probability that is between and
d) What value of separates the smaller of the standard normal distribution from the larger ?
e) What values of and separate the middle of the standard normal distribution from the extreme ?
(Essay)
4.9/5 (41)
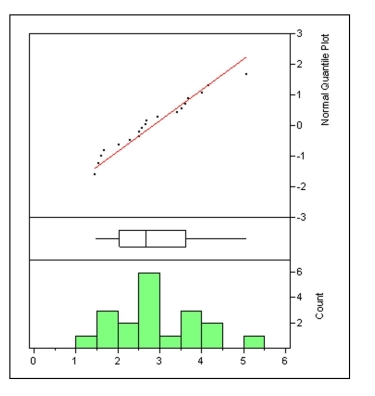
The Economist is a weekly newspaper that focuses on international politics, business news, and opinion. Each year the "Big Mac Index," the price (\ U. S.) of a Big Mac in countries around the world, is published as a light-hearted way of comparing currencies. Displayed at right are 3 views of the BMIs in mid-summer, 2007: the normal probability plot, a box and whisker plot, and a histogram. Using one of the three plots, discuss any indication of skew you see. In your discussion be specific about what aspect(s) of the graph you feel is/are indicative of skew.
(Essay)
4.9/5 (31)
Determine the following areas under the standard normal (z) curve.
a) The area under the z curve to the left of 1.56
b) The area under the z curve to the left of -2.13
c) The area under the z curve to the right of 0.88
d) The area under the z curve to the right of -1.23
e) The area under the z curve between -2 and 3
f) The area under the z curve between -2.4 and -1.4
(Essay)
4.8/5 (32)
Electric power cords are a common hazard in households with computers. They are
easily tripped over and the delicate computer equipment may be pulled from tables
and damaged. A new "breakaway" power cord has been designed by Alpha
Enterprises. Alpha has determined that a breakaway force of between 3.0 and 5.0
pounds is appropriate. (If the force is too low the cord would break in normal use; if
the force is too high the cord would not be effective.) Alpha can order cord material
from two companies, Beta and Gamma. The breakaway force for the Beta material
is approximately normally distributed with a mean of 4.5 pounds and a standard
deviation of 1.0 pounds. The breakaway force for the Gamma material is
approximately normally distributed with a mean of 4.0 pounds and a standard
deviation of 1.5 pounds.
Alpha will choose the cord material that has the higher probability of breaking within
the specified 3.0 and 5.0 pound limits. From which company should Alpha order
cord material? Provide appropriate statistical justification for your choice.
(Essay)
4.7/5 (27)
Road construction in the town of Hiawatha has presented some problems for the
traffic engineers. Small businesses such as Bev's Hair Gallery will require an
alternate entrance for their customers. This will in turn create a minor congestion of
traffic nearby because cars will be backed up and the entrance to the parking lot. The
engineers have studied the problem using simulations based on current traffic
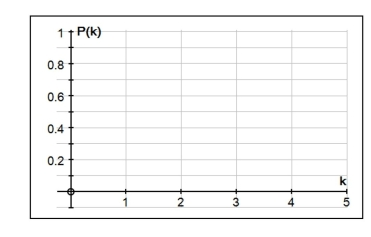
patterns. The results from 500 trials are shown below: Number of times cars are backed up at the entrance 0 250 1 150 2 75 3 25 Let the random variable k = number of cars backed up at the entrance.
a) Fill in the table below with the estimated probability distribution of k, and sketch
a probability histogram for x. Probability distribution
k (x) 2 3
Probability histogram
 b) Using the estimated probabilities in part (a), calculate the following: i) , the probability that 1 car is backed up at the entrance.
ii) , the probability that fewer than 2 cars are backed up at the entrance
iii) , the probability that at least 1 car is backed up at the entrance
b) Using the estimated probabilities in part (a), calculate the following: i) , the probability that 1 car is backed up at the entrance.
ii) , the probability that fewer than 2 cars are backed up at the entrance
iii) , the probability that at least 1 car is backed up at the entrance
(Essay)
4.8/5 (33)
When driving the nation's highways, Anna is known as something of a lead foot. Her
number of miles per hour over the speed limit varies, but has a mean of 7.5 mph and
standard deviation of 2 mph. Unfortunately her state adjusts the fines so that the
amount of the fine (in dollars) is given by the formula: where F is the amount of the fine, and MilesOver is the number of miles over the
speed limit. Let random variable F be the amount of her fine if she is stopped for
speeding.
a) What is the mean of F?
b) What is the standard deviation of F?
(Essay)
4.7/5 (38)
Inspecting meat is a very important part of the process of ensuring healthy food. So
that meat inspectors do not fall into a pattern of inspection, they use a 4-sided die to
decide whether or not to sample the meat from a particular "side" of beef. The meat
inspector rolls the die and if it comes up a 4, a sample is taken of that meat. Define
random variable x number of samples inspected in a meat locker with 30 sides of
beef.
a) What is the mean of the random variable x?
b) What is the standard deviation of the random variable x?
(Essay)
4.9/5 (26)
In a study performed by the statistics classes at Jefferson High School, city parking
spaces were examined for compliance with the requirement to put money in the
parking meters. Overall, the students found that 80% of metered parking places had
meters that were not expired, and 20% had meters that were expired. If the traffic
officer in charge of ticketing checks meters at random, what is the probability he or
she will find an expired meter before the 3rd one checked?
(Essay)
4.8/5 (37)
Using the notation C = continuous and D = discrete, indicate whether each of the
random variables is discrete or continuous.
a) The number of steps to the principal's office from a randomly selected location
at a particular school.
b) The average night time temperature on a randomly selected day in July at Long's
Peak in Colorado
c) The number of eggs in a kitchen on a randomly selected day.
d) The number of sentences in a short story selected at random from a collection
of short stories.
e) The circumference of a randomly selected California redwood tree
(Essay)
4.8/5 (37)
The graphs below are normal probability plots of the vocabulary and math concept
scores on a standardized exam for a large sample of students. One of the score
distributions is approximately normal. Identify the score distribution that is
approximately normal and explain the reason for your choice. 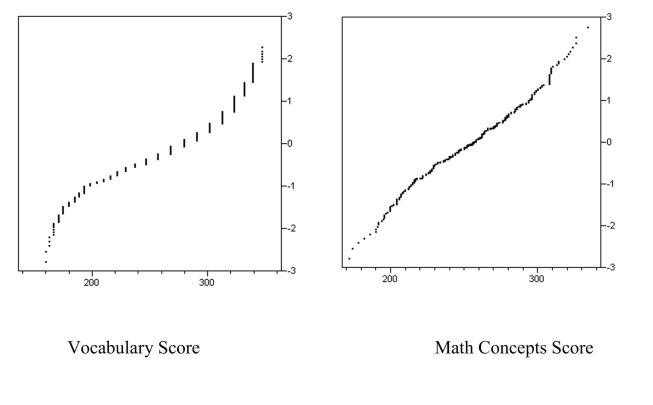
(Essay)
4.7/5 (31)
Filters
- Essay(0)
- Multiple Choice(0)
- Short Answer(0)
- True False(0)
- Matching(0)