Exam 8: Functions and Their Graphs
Exam 1: Real Numbers603 Questions
Exam 2: Solving Linear Equations and Inequalities193 Questions
Exam 3: Applications of Algebra93 Questions
Exam 4: Graphing Linear Equations125 Questions
Exam 5: Exponents and Polynomials355 Questions
Exam 6: Factoring196 Questions
Exam 7: Rational Expressions and Equations250 Questions
Exam 8: Functions and Their Graphs125 Questions
Exam 9: Systems of Linear Equations139 Questions
Exam 10: Inequalities in One and Two Variables111 Questions
Exam 11: Roots, Radicals, and Complex Numbers288 Questions
Exam 12: Quadratic Functions219 Questions
Exam 13: Exponential and Logarithmic Functions229 Questions
Exam 14: Conic Sections104 Questions
Exam 15: Sequences, Series, and the Binomial Theorem140 Questions
Exam 16: Appendix Review of Decimals and Percent82 Questions
Select questions type
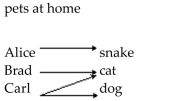
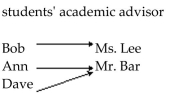
Determine if the relation illustrated is a function. Give the domain and range of the function or relation.
-
(Multiple Choice)
4.9/5  (41)
(41)
Solve the problem.
-The cost C, in dollars, to produce x graphing calculators is given by the function graphed below. Estimate the number of calculators that can be produced if cost is limited to $2925. 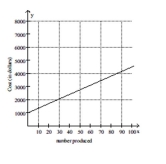
(Multiple Choice)
4.9/5 (29)
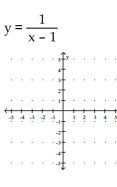
Use a calculator to obtain at least eight points that are solutions to the equation. Then graph the equation by plotting
points.
-
(Essay)
4.8/5 (28)
The graph below shows the percentage of students enrolled in the College of Engineering at State University. Use the
graph to answer the question. 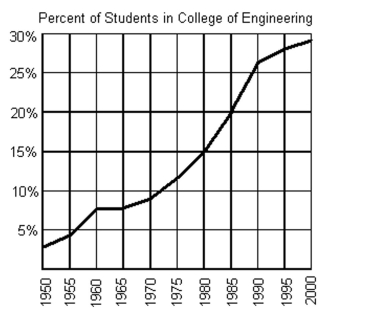 -Does the graph represent a function?
(Multiple Choice)
4.9/5 (44)
List the set in roster form.
-S = {x| x is an odd integer greater than 33 and less than or equal to 39}
(Multiple Choice)
4.9/5 (36)
Provide an appropriate response.
-In the notation y = f(x), y is the variable.
(Multiple Choice)
4.8/5 (28)
Solve the problem.
-A freight train traveled at a speed of 50 mph for 3 hours, then stayed in a station for 1 hour, and then traveled 30 mph for 2 hours. Make a graph of distance traveled versus time to match the given situation. 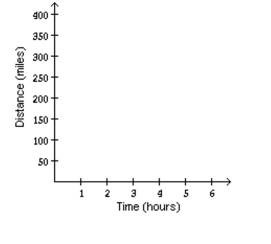
(Multiple Choice)
4.8/5 (37)
Determine if the relation illustrated is a function. Give the domain and range of the function or relation.
-
(Multiple Choice)
4.8/5 (31)
Solve the problem.
-The graph below shows the total sales of houses in a town from 2000 to 2005. The graph also shows the sale of houses in the summer , S, and in the other times of the year, Y. 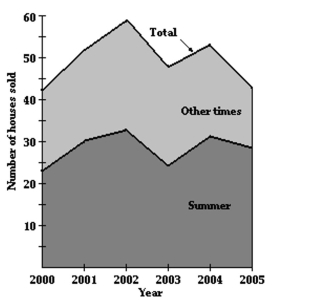 Estimate The number of houses sold in the summer of 2004.
(Multiple Choice)
4.8/5 (35)
List the set in roster form.
-S = {x| x is and integer between 4 and 5}
(Multiple Choice)
4.9/5 (26)
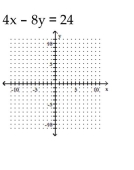
Graph the linear function by plotting the x- and y-intercepts.
-
(Multiple Choice)
4.7/5 (38)
Solve the problem.
-The following graph shows the effect of compound interest. It shows the growth of $100 invested at 5% interest compounded annually. Starting at year 15 , approximately how long will it take for the money to double? 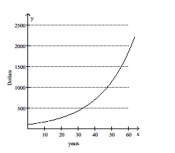
(Multiple Choice)
4.8/5 (36)
Filters
- Essay(0)
- Multiple Choice(0)
- Short Answer(0)
- True False(0)
- Matching(0)