Exam 8: Functions and Their Graphs
Exam 1: Real Numbers603 Questions
Exam 2: Solving Linear Equations and Inequalities193 Questions
Exam 3: Applications of Algebra93 Questions
Exam 4: Graphing Linear Equations125 Questions
Exam 5: Exponents and Polynomials355 Questions
Exam 6: Factoring196 Questions
Exam 7: Rational Expressions and Equations250 Questions
Exam 8: Functions and Their Graphs125 Questions
Exam 9: Systems of Linear Equations139 Questions
Exam 10: Inequalities in One and Two Variables111 Questions
Exam 11: Roots, Radicals, and Complex Numbers288 Questions
Exam 12: Quadratic Functions219 Questions
Exam 13: Exponential and Logarithmic Functions229 Questions
Exam 14: Conic Sections104 Questions
Exam 15: Sequences, Series, and the Binomial Theorem140 Questions
Exam 16: Appendix Review of Decimals and Percent82 Questions
Select questions type
Find the equation of a line with the properties given. Write the equation in the form indicated.
-Through (6, -6) and parallel to 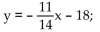 standard form
(Multiple Choice)
4.9/5  (36)
(36)
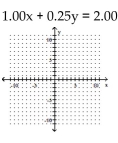
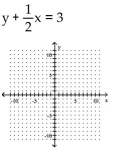
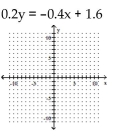
Graph the linear function by plotting the x- and y-intercepts.
-
(Multiple Choice)
4.8/5 (23)
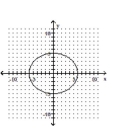
Determine whether the graph illustrated represents a function. Give the domain and range of the relation or function.
-
(Multiple Choice)
4.8/5 (28)
Express in set builder notation the set of numbers indicated on the number line.
-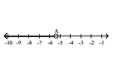 A = -5.4
(Multiple Choice)
4.8/5 (32)
Determine if the relation illustrated is a function. Give the domain and range of the function or relation.
-
(Multiple Choice)
4.9/5 (34)
Provide an appropriate response.
-In the notation y = f(x), x is the variable.
(Multiple Choice)
4.9/5 (35)
Find the equation of a line with the properties given. Write the equation in the form indicated.
-Through (5, 4) and parallel to the line whose equation is y = - 13 x + 5; function notation
(Multiple Choice)
4.9/5 (35)
Two points on L1 and two points on L2 are given. Determine whether L1 is parallel to L2, L1 is perpendicular to L2, or
neither.
-L1: (1, -3), (2, -7); L2: (3, 3), (7, 4)
(Multiple Choice)
4.9/5 (43)
Solve the problem.
-The cost C, in dollars, to produce computers is given by the function C(x) = 125x + 4500 where x is the number of computers produced. Draw a graph of cost versus the number of computers produced on the coordinate
System provided. 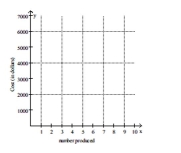
(Multiple Choice)
4.7/5 (39)
Graph the linear function by plotting the x- and y-intercepts.
-
(Multiple Choice)
4.8/5 (30)
Solve the problem.
-The graph below shows the total sales of houses in a town from 2000 to 2005. The graph also shows the sale of houses in the summer , S, and in the other times of the year, Y. 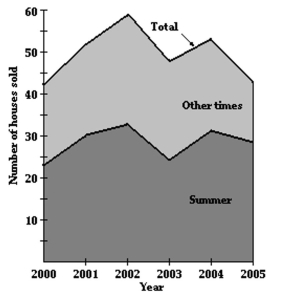 Estimate Y(2003)
(Multiple Choice)
4.8/5 (34)
Graph the linear function by plotting the x- and y-intercepts.
-
(Multiple Choice)
4.7/5 (44)
Solve the problem.
-Mark started out by walking up a hill for 5 minutes. For the next 5 minutes he walked down a steep hill to an elevation lower than his starting point. For the next 10 minutes he walked on level ground. For the next 10
Minutes he walked uphill. Determine which graph of elevation above sea level versus time matches the given
Situation.
(Multiple Choice)
4.9/5 (30)
Find the x- and y-intercepts of the graph of the equation using a graphing calculator. Round to three decimal places, if
necessary.
-12x - 24y = 8
(Multiple Choice)
4.9/5 (42)
Filters
- Essay(0)
- Multiple Choice(0)
- Short Answer(0)
- True False(0)
- Matching(0)