Exam 8: Functions and Their Graphs
Exam 1: Real Numbers603 Questions
Exam 2: Solving Linear Equations and Inequalities193 Questions
Exam 3: Applications of Algebra93 Questions
Exam 4: Graphing Linear Equations125 Questions
Exam 5: Exponents and Polynomials355 Questions
Exam 6: Factoring196 Questions
Exam 7: Rational Expressions and Equations250 Questions
Exam 8: Functions and Their Graphs125 Questions
Exam 9: Systems of Linear Equations139 Questions
Exam 10: Inequalities in One and Two Variables111 Questions
Exam 11: Roots, Radicals, and Complex Numbers288 Questions
Exam 12: Quadratic Functions219 Questions
Exam 13: Exponential and Logarithmic Functions229 Questions
Exam 14: Conic Sections104 Questions
Exam 15: Sequences, Series, and the Binomial Theorem140 Questions
Exam 16: Appendix Review of Decimals and Percent82 Questions
Select questions type
Evaluate the function for the indicated value.
-f(x) = -3x + 1; find f(3)
(Multiple Choice)
4.9/5  (32)
(32)
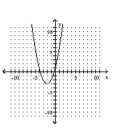
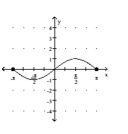
Determine whether the graph illustrated represents a function. Give the domain and range of the relation or function.
-
(Multiple Choice)
4.9/5 (39)
Solve the problem.
-The cost C, in dollars, to produce x graphing calculators is given by the function graphed below. Estimate the cost of producing 55 calculators. 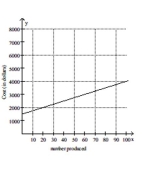
(Multiple Choice)
4.9/5 (40)
The graph below shows the percentage of students enrolled in the College of Engineering at State University. Use the
graph to answer the question. 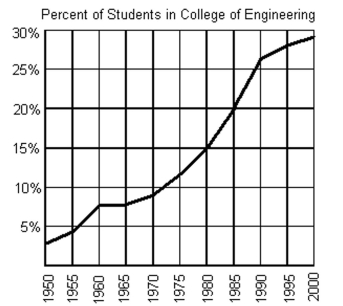 -What percentage of the students at State University were enrolled in the College of Engineering in 1965?
(Multiple Choice)
4.8/5 (38)
Determine whether the graph illustrated represents a function. Give the domain and range of the relation or function.
-
(Multiple Choice)
4.8/5 (33)
The graph below shows the percentage of students enrolled in the College of Engineering at State University. Use the
graph to answer the question. 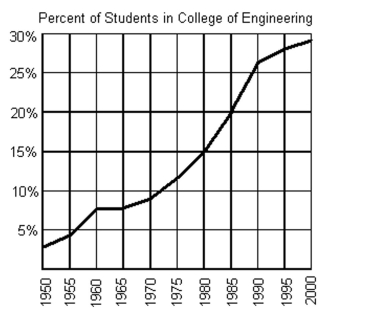 -If f represents the function, find f(2000).
(Multiple Choice)
4.8/5 (33)
Solve the problem.
-The graph below shows the total sales of houses in a town from 2000 to 2005. The graph also shows the sale of houses in the summer , S, and in the other times of the year, Y. 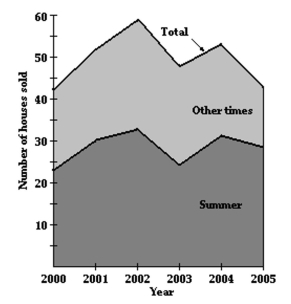 Estimate (S+Y)(2001).
(Multiple Choice)
4.9/5 (32)
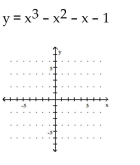
Use a calculator to obtain at least eight points that are solutions to the equation. Then graph the equation by plotting
points.
-
(Essay)
4.8/5 (22)
Solve the problem.
-If a line passes through the points (-6, 5) and (4, 13), find the change of y with respect to a 1-unit change in x. Round to three decimal places, if necessary.
(Multiple Choice)
4.8/5 (38)
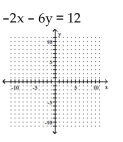
Graph the linear function by plotting the x- and y-intercepts.
-
(Multiple Choice)
4.8/5 (26)
Solve the problem.
-The formula for the volume of a right circular cylinder is  . If the height is 19 m, then the volume is a function of the radius, r. Write the function using function notation, where the height is 19. Determine the
Volume if the radius is 11 m.
. If the height is 19 m, then the volume is a function of the radius, r. Write the function using function notation, where the height is 19. Determine the
Volume if the radius is 11 m.
(Multiple Choice)
4.8/5 (40)
Find the equation of a line with the properties given. Write the equation in the form indicated.
-Through (4, 4) and perpendicular to the line whose equation is  function notation
(Multiple Choice)
4.9/5 (39)
Determine whether the two given lines are parallel, perpendicular, or neither.
-
(Multiple Choice)
4.8/5 (37)
Solve the problem.
-An investment is worth $3681 in 1994. By 1997 it has grown to $4674. Let V be the value of the investment in the year x, where x = 0 represents 1994. Write a linear function that models the value of the investment in the
Year x.
(Multiple Choice)
4.8/5 (34)
Filters
- Essay(0)
- Multiple Choice(0)
- Short Answer(0)
- True False(0)
- Matching(0)