Exam 8: Functions and Their Graphs
Exam 1: Real Numbers603 Questions
Exam 2: Solving Linear Equations and Inequalities193 Questions
Exam 3: Applications of Algebra93 Questions
Exam 4: Graphing Linear Equations125 Questions
Exam 5: Exponents and Polynomials355 Questions
Exam 6: Factoring196 Questions
Exam 7: Rational Expressions and Equations250 Questions
Exam 8: Functions and Their Graphs125 Questions
Exam 9: Systems of Linear Equations139 Questions
Exam 10: Inequalities in One and Two Variables111 Questions
Exam 11: Roots, Radicals, and Complex Numbers288 Questions
Exam 12: Quadratic Functions219 Questions
Exam 13: Exponential and Logarithmic Functions229 Questions
Exam 14: Conic Sections104 Questions
Exam 15: Sequences, Series, and the Binomial Theorem140 Questions
Exam 16: Appendix Review of Decimals and Percent82 Questions
Select questions type
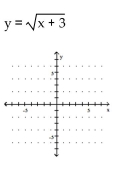
Use a calculator to obtain at least eight points that are solutions to the equation. Then graph the equation by plotting
points.
-
(Essay)
4.9/5  (30)
(30)
Solve the problem.
-The gas mileage, m, of a compact car is a linear function of the speed, s, at which the car is driven, for 40 ≤ s ≤ 90. For example, from the graph we see that the gas mileage for the compact car is 45 miles per gallon if the car is
Driven at a speed of 40 mph. 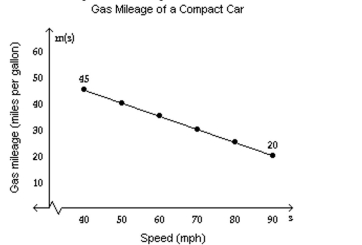 i) Using the two points on the graph, determine the function m(s) that can be used to approximate the graph.
Ii) Using the function from part i, estimate the gas mileage if the compact car is traveling 43 mph. If necessary, round
To the nearest tenth.
Iii) Using the function from part i, estimate the speed of the compact car if the gas mileage is 41 miles per gallon. If
Necessary, round to the nearest tenth.
i) Using the two points on the graph, determine the function m(s) that can be used to approximate the graph.
Ii) Using the function from part i, estimate the gas mileage if the compact car is traveling 43 mph. If necessary, round
To the nearest tenth.
Iii) Using the function from part i, estimate the speed of the compact car if the gas mileage is 41 miles per gallon. If
Necessary, round to the nearest tenth.
(Multiple Choice)
4.8/5 (36)
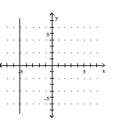
Determine whether the graph illustrated represents a function. Give the domain and range of the relation or function.
-
(Multiple Choice)
4.9/5 (37)
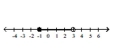
Express in set builder notation the set of numbers indicated on the number line.
-
(Multiple Choice)
5.0/5 (39)
Solve the problem.
-The graph below shows the total sales of houses in a town from 2000 to 2005. The graph also shows the sale of houses in the summer , S, and in the other times of the year, Y. 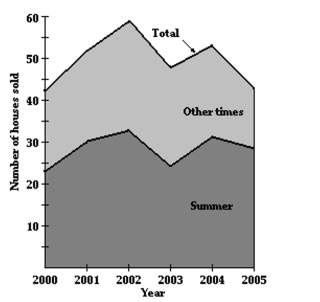 Estimate The number of houses sold at other times in 2002.
(Multiple Choice)
4.9/5 (24)
Find the equation of a line with the properties given. Write the equation in the form indicated.
-Through (2, 4) and parallel to the line whose equation is 5x + y = 9; slope-intercept form
(Multiple Choice)
4.8/5 (36)
Solve the problem.
-In 1995, the average annual salary for elementary school teachers was $24, 269. In 2000, the average annual salary for elementary school teachers was $28,148. Let S be the average annual salary in the year x, where x = 0
Represents the year 1995.
a) Write a linear function that models the average annual salary for elementary school teachers in terms of year x.
b) Use this function to determine the average annual salary for elementary school teachers in 2005.
(Multiple Choice)
4.9/5 (41)
Determine whether the two given lines are parallel, perpendicular, or neither.
-x = y + 6 y = 3x - 4
(Multiple Choice)
4.8/5 (38)
Solve the problem.
-The graph shows the projected radio sales (in millions) for a particular company. 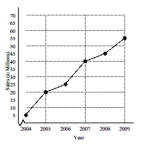 Determine the average rate of change from 2005 to 2008. Round to two decimal places if necessary.
(Multiple Choice)
4.7/5 (31)
Solve the problem.
-The population of fruit flies, p, after n days from the first mating of ten flies is given by the function 
(Multiple Choice)
4.9/5 (39)
Determine if the relation illustrated is a function. Give the domain and range of the function or relation.
-{(-4, 11), (-3, 4), (0, -5), (3, 4), (5, 20)}
(Multiple Choice)
4.8/5 (24)
Provide an appropriate response.
-A relation is any set of .
(Multiple Choice)
4.8/5 (35)
Determine whether the two given lines are parallel, perpendicular, or neither.
-
(Multiple Choice)
4.8/5 (36)
Determine whether the two given lines are parallel, perpendicular, or neither.
-
(Multiple Choice)
4.7/5 (28)
Find the equation of a line with the properties given. Write the equation in the form indicated.
-Passing through (3, 3) and perpendicular to the line whose equation is -9x + y = 5; slope-intercept form
(Multiple Choice)
4.9/5 (37)
Solve the problem.
-A truck rental company rents a moving truck one day by charging $27 plus $0.13 per mile. Write a linear equation that relates the cost C, in dollars, of renting the truck to the number x of miles driven. What is the cost
Of renting the truck if the truck is driven 190 miles?
(Multiple Choice)
4.8/5 (32)
Filters
- Essay(0)
- Multiple Choice(0)
- Short Answer(0)
- True False(0)
- Matching(0)