Exam 8: Functions and Their Graphs
Exam 1: Real Numbers603 Questions
Exam 2: Solving Linear Equations and Inequalities193 Questions
Exam 3: Applications of Algebra93 Questions
Exam 4: Graphing Linear Equations125 Questions
Exam 5: Exponents and Polynomials355 Questions
Exam 6: Factoring196 Questions
Exam 7: Rational Expressions and Equations250 Questions
Exam 8: Functions and Their Graphs125 Questions
Exam 9: Systems of Linear Equations139 Questions
Exam 10: Inequalities in One and Two Variables111 Questions
Exam 11: Roots, Radicals, and Complex Numbers288 Questions
Exam 12: Quadratic Functions219 Questions
Exam 13: Exponential and Logarithmic Functions229 Questions
Exam 14: Conic Sections104 Questions
Exam 15: Sequences, Series, and the Binomial Theorem140 Questions
Exam 16: Appendix Review of Decimals and Percent82 Questions
Select questions type
Provide an appropriate response.
-The set of of a relation is called the domain of the relation.
(Multiple Choice)
4.8/5  (24)
(24)
Solve the problem.
-The following graph shows the private, public and total national school enrollment for students for select years from 1970 through 2000. 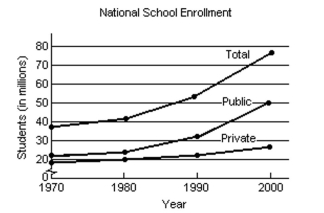 i) How is the graph for total school enrollment, T, determined from the graph of the private enrollment, r, and the
Public enrollment, u?
Ii) During which 10-year period did the total number of students enrolled increase the least?
Iii) During which 10-year period did the total number of students enrolled increase the most?
i) How is the graph for total school enrollment, T, determined from the graph of the private enrollment, r, and the
Public enrollment, u?
Ii) During which 10-year period did the total number of students enrolled increase the least?
Iii) During which 10-year period did the total number of students enrolled increase the most?
(Multiple Choice)
4.7/5 (32)
Solve the problem.
-Sue and Bob have each saved money during every year from 2000 to 2005. The following bar graph shows the amounts saved each of those years. 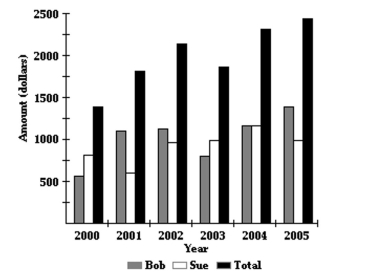 In 2001, estimate how much more Bob saved than Sue.
(Multiple Choice)
4.8/5 (37)
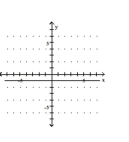
Determine whether the graph illustrated represents a function. Give the domain and range of the relation or function.
-
(Multiple Choice)
4.9/5 (35)
Solve the problem.
-The formula for changing Celsius temperature to Fahrenheit temperature is  The Fahrenheit temperature is a function of the Celsius temperature. Write the function in function notation. Find the
Fahrenheit temperature that corresponds to 20° C.
The Fahrenheit temperature is a function of the Celsius temperature. Write the function in function notation. Find the
Fahrenheit temperature that corresponds to 20° C.
(Multiple Choice)
4.9/5 (38)
Solve the problem.
-The formula for the circumference of a circle is  The circumference is a function of the radius. Write the function using function notation. Determine the circumference when the radius is 4 mi.
(Multiple Choice)
5.0/5 (28)
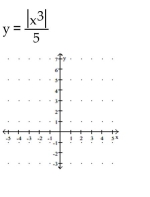
Use a calculator to obtain at least eight points that are solutions to the equation. Then graph the equation by plotting
points.
-
(Essay)
4.7/5 (32)
Solve the problem.
-The following bar graph shows the average annual income for single mothers. 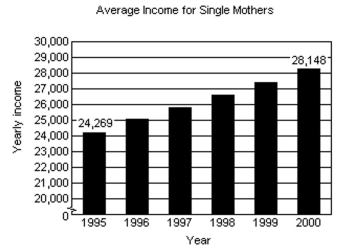 i) Determine a linear function that can be used to estimate the average yearly income for single mothers from 1995 through 2000. Let t represent the number of years from 1995. (In other words, 1995 corresponds to t = 0, 1996
Corresponds to t = 1, and so on.)
Ii) Using the function from part i, determine the average yearly income for single mothers in 1996.
Iii) Assuming this trend continues, determine the average yearly income for single mothers in 2010.
Iv) Assuming this trend continues, in which year will the average yearly income for single mothers reach $31,000?
i) Determine a linear function that can be used to estimate the average yearly income for single mothers from 1995 through 2000. Let t represent the number of years from 1995. (In other words, 1995 corresponds to t = 0, 1996
Corresponds to t = 1, and so on.)
Ii) Using the function from part i, determine the average yearly income for single mothers in 1996.
Iii) Assuming this trend continues, determine the average yearly income for single mothers in 2010.
Iv) Assuming this trend continues, in which year will the average yearly income for single mothers reach $31,000?
(Multiple Choice)
5.0/5 (38)
Two points on L1 and two points on L2 are given. Determine whether L1 is parallel to L2, L1 is perpendicular to L2, or
neither.
-
(Multiple Choice)
4.8/5 (24)
Solve the problem.
-A vendor has learned that, by pricing pretzels at $1.50, sales will reach 92 pretzels per day. Raising the price to $2.50 will cause the sales to fall to 48 pretzels per day. The number of pretzels, N, is a linear function of the
Price, x. Write a linear function that models the number of pretzels sold per day when the price is x dollars
Each.
(Multiple Choice)
4.8/5 (36)
Determine whether the two given lines are parallel, perpendicular, or neither.
--5x = -2y - 6 y = x - 7
(Multiple Choice)
4.9/5 (32)
Determine whether the graph illustrated represents a function. Give the domain and range of the relation or function.
-
(Multiple Choice)
5.0/5 (33)
List the set in roster form.
-S = {x| x is a whole number multiple of 2}
(Multiple Choice)
4.7/5 (36)
List the set in roster form.
-S = {x| x is a whole number less than 6}
(Multiple Choice)
4.7/5 (27)
Filters
- Essay(0)
- Multiple Choice(0)
- Short Answer(0)
- True False(0)
- Matching(0)