Exam 11: Analysis of Variance
Exam 1: Defining and Collecting Data207 Questions
Exam 2: Organizing and Visualizing Variables213 Questions
Exam 3: Numerical Descriptive Measures167 Questions
Exam 4: Basic Probability171 Questions
Exam 5: Discrete Probability Distributions217 Questions
Exam 6: The Normal Distributions and Other Continuous Distributions189 Questions
Exam 7: Sampling Distributions135 Questions
Exam 8: Confidence Interval Estimation189 Questions
Exam 9: Fundamentals of Hypothesis Testing: One-Sample Tests187 Questions
Exam 10: Two-Sample Tests208 Questions
Exam 11: Analysis of Variance216 Questions
Exam 12: Chi-Square and Nonparametric Tests178 Questions
Exam 13: Simple Linear Regression214 Questions
Exam 14: Introduction to Multiple Regression336 Questions
Exam 15: Multiple Regression Model Building99 Questions
Exam 16: Time-Series Forecasting173 Questions
Exam 17: Business Analytics115 Questions
Exam 18: A Roadmap for Analyzing Data329 Questions
Exam 19: Statistical Applications in Quality Management Online162 Questions
Exam 20: Decision Making Online129 Questions
Exam 21: Understanding Statistics: Descriptive and Inferential Techniques39 Questions
Select questions type
SCENARIO 11-4 An agronomist wants to compare the crop yield of 3 varieties of chickpea seeds.She plants 15 fields, 5 with each variety.She then measures the crop yield in bushels per acre.Treating this as a completely randomized design, the results are presented in the table that follows. 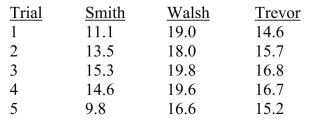 -Referring to Scenario 11-4, state the null hypothesis that can be tested.
(Short Answer)
4.8/5  (38)
(38)
SCENARIO 11-7 A student team in a business statistics course designed an experiment to investigate whether the brand of bubblegum used affected the size of bubbles they could blow.To reduce the person-to- person variability, the students decided to use a randomized block design using themselves as blocks. Four brands of bubblegum were tested.A student chewed two pieces of a brand of gum and then blew a bubble, attempting to make it as big as possible.Another student measured the diameter of the bubble at its biggest point.The following table gives the diameters of the bubbles (in inches)for the 16 observations. 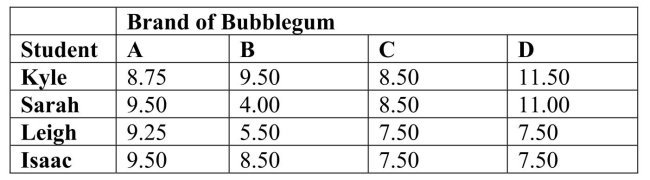 -Referring to Scenario 11-7, is it appropriate to use the Tukey multiple comparison procedure based on the test result above?
(Short Answer)
4.7/5 (44)
SCENARIO 11-7 A student team in a business statistics course designed an experiment to investigate whether the brand of bubblegum used affected the size of bubbles they could blow.To reduce the person-to- person variability, the students decided to use a randomized block design using themselves as blocks. Four brands of bubblegum were tested.A student chewed two pieces of a brand of gum and then blew a bubble, attempting to make it as big as possible.Another student measured the diameter of the bubble at its biggest point.The following table gives the diameters of the bubbles (in inches)for the 16 observations.
-Referring to Scenario 11-7, the randomized block F test is valid only if the population of diameters is normally distributed for the 4 brands.
(True/False)
5.0/5 (40)
SCENARIO 11-2 A realtor wants to compare the mean sales-to-appraisal ratios of residential properties sold in four neighborhoods (A, B, C, and D).Four properties are randomly selected from each neighborhood and the ratios recorded for each, as shown below. 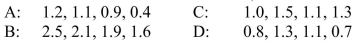 Interpret the results of the analysis summarized in the following table:
 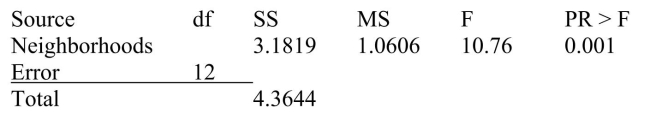 -Referring to Scenario 11-2, the null hypothesis for Levene's test for homogeneity of variances is
(Multiple Choice)
4.8/5 (43)
SCENARIO 11-4 An agronomist wants to compare the crop yield of 3 varieties of chickpea seeds.She plants 15 fields, 5 with each variety.She then measures the crop yield in bushels per acre.Treating this as a completely randomized design, the results are presented in the table that follows.
-Referring to Scenario 11-4, construct the ANOVA table from the sample data.
(Short Answer)
4.9/5 (38)
SCENARIO 11-8 An important factor in selecting database software is the time required for a user to learn how to use the system.To evaluate three potential brands (A, B and C)of database software, a company designed a test involving five different employees.To reduce variability due to differences among employees, each of the five employees is trained on each of the three different brands. The amount of time (in hours)needed to learn each of the three different brands is given below: 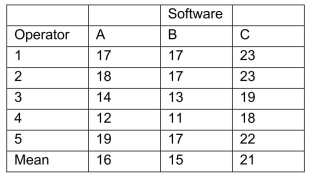 Below is the Excel output for the randomized block design:
 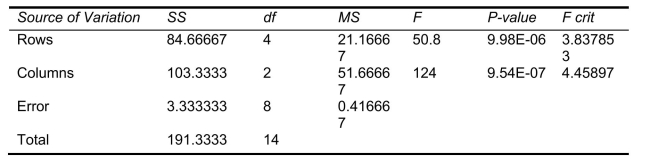 -Referring to Scenario 11-8, what is the estimated relative efficiency?
(Short Answer)
4.8/5 (28)
SCENARIO 11-8 An important factor in selecting database software is the time required for a user to learn how to use the system.To evaluate three potential brands (A, B and C)of database software, a company designed a test involving five different employees.To reduce variability due to differences among employees, each of the five employees is trained on each of the three different brands. The amount of time (in hours)needed to learn each of the three different brands is given below: Below is the Excel output for the randomized block design:
-Referring to Scenario 11-8, what is the critical value of the randomized block F test for the difference in the means at a level of significance of 0.05?
(Short Answer)
4.8/5 (33)
SCENARIO 11-7 A student team in a business statistics course designed an experiment to investigate whether the brand of bubblegum used affected the size of bubbles they could blow.To reduce the person-to- person variability, the students decided to use a randomized block design using themselves as blocks. Four brands of bubblegum were tested.A student chewed two pieces of a brand of gum and then blew a bubble, attempting to make it as big as possible.Another student measured the diameter of the bubble at its biggest point.The following table gives the diameters of the bubbles (in inches)for the 16 observations.
-Referring to Scenario 11-7, what is the critical value for testing the block effects at a 0.05 level of significance?
(Short Answer)
4.7/5 (38)
SCENARIO 11-8 An important factor in selecting database software is the time required for a user to learn how to use the system.To evaluate three potential brands (A, B and C)of database software, a company designed a test involving five different employees.To reduce variability due to differences among employees, each of the five employees is trained on each of the three different brands. The amount of time (in hours)needed to learn each of the three different brands is given below: Below is the Excel output for the randomized block design:
-Referring to Scenario 11-8, the value of MSA is __________, while MSBL is __________.
(Short Answer)
4.8/5 (43)
SCENARIO 11-7 A student team in a business statistics course designed an experiment to investigate whether the brand of bubblegum used affected the size of bubbles they could blow.To reduce the person-to- person variability, the students decided to use a randomized block design using themselves as blocks. Four brands of bubblegum were tested.A student chewed two pieces of a brand of gum and then blew a bubble, attempting to make it as big as possible.Another student measured the diameter of the bubble at its biggest point.The following table gives the diameters of the bubbles (in inches)for the 16 observations.
-Referring to Scenario 11-7, the among-group variation or SSA is __________.
(Short Answer)
4.9/5 (33)
In a two-way ANOVA, the degrees of freedom for the interaction term is
(Multiple Choice)
4.9/5 (42)
SCENARIO 11-3 As part of an evaluation program, a sporting goods retailer wanted to compare the downhill coasting speeds of 4 brands of bicycles.She took 3 of each brand and determined their maximum downhill speeds.The results are presented in miles per hour in the table below. 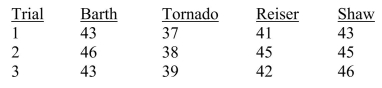 -Referring to Scenario 11-3, using an overall level of significance of 0.05, the critical value of the Studentized range
  used in calculating the critical range for the Tukey-Kramer procedure is ________.
(Short Answer)
4.8/5 (41)
SCENARIO 11-3 As part of an evaluation program, a sporting goods retailer wanted to compare the downhill coasting speeds of 4 brands of bicycles.She took 3 of each brand and determined their maximum downhill speeds.The results are presented in miles per hour in the table below.
-Referring to Scenario 11-3, the test is valid only if the population of speeds has the same variance for the 4 brands.
(True/False)
4.8/5 (47)
SCENARIO 11-6 An agronomist wants to compare the crop yield of 3 varieties of chickpea seeds.She plants all 3 varieties of the seeds on each of 5 different patches of fields.She then measures the crop yield in bushels per acre.Treating this as a randomized block design, the results are presented in the table that follows. 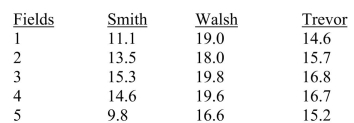 -Referring to Scenario 11-6, the relative efficiency means that 2.47 times as many observations in each variety group would be needed in a one-way ANOVA design as compared to the randomized block design in order to obtain the same precision for comparison of the variety means.
(True/False)
4.9/5 (38)
SCENARIO 11-10 A campus researcher wanted to investigate the factors that affect visitor travel time in a complex, multilevel building on campus.Specifically, he wanted to determine whether different building signs (building maps versus wall signage)affect the total amount of time visitors require to reach their destination and whether that time depends on whether the starting location is inside or outside the building.Three subjects were assigned to each of the combinations of signs and starting locations, and travel time in seconds from beginning to destination was recorded.An Excel output of the appropriate analysis is given below: 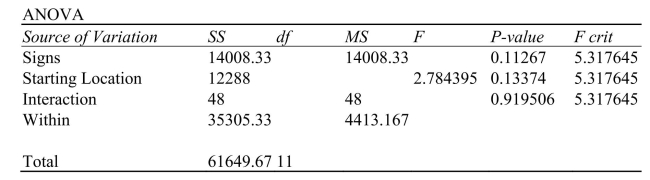 -Referring to Scenario 11-10, the degrees of freedom for the different building signs (factor A)is
(Multiple Choice)
4.9/5 (32)
SCENARIO 11-7 A student team in a business statistics course designed an experiment to investigate whether the brand of bubblegum used affected the size of bubbles they could blow.To reduce the person-to- person variability, the students decided to use a randomized block design using themselves as blocks. Four brands of bubblegum were tested.A student chewed two pieces of a brand of gum and then blew a bubble, attempting to make it as big as possible.Another student measured the diameter of the bubble at its biggest point.The following table gives the diameters of the bubbles (in inches)for the 16 observations.
-Referring to Scenario 11-7, the randomized block F test is valid only if the population of diameters has the same variance for the 4 brands.
(True/False)
4.9/5 (37)
SCENARIO 11-12 The marketing manager of a company producing a new cereal aimed for children wants to examine the effect of the color and shape of the box's logo on the approval rating of the cereal. He combined 4 colors and 3 shapes to produce a total of 12 designs.Each logo was presented to 2 different groups (a total of 24 groups)and the approval rating for each was recorded and is shown below.The manager analyzed these data using the  = 0.05 level of significance for all inferences.
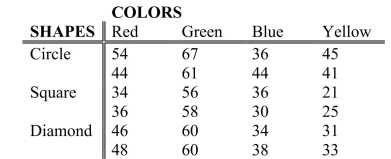
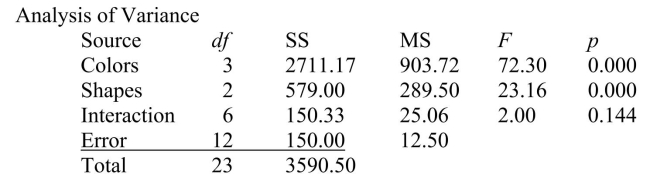 -Referring to Scenario 11-12, based on the results of the hypothesis test, it appears that there is a significant effect associated with the shape of the logo.
(True/False)
4.8/5 (38)
SCENARIO 11-3 As part of an evaluation program, a sporting goods retailer wanted to compare the downhill coasting speeds of 4 brands of bicycles.She took 3 of each brand and determined their maximum downhill speeds.The results are presented in miles per hour in the table below.
-Referring to Scenario 11-3, the sporting goods retailer decided to compare the 4 treatment means by using the Tukey-Kramer procedure with an overall level of significance of 0.05. There are ________ pairwise comparisons that can be made.
(Short Answer)
4.9/5 (39)
SCENARIO 11-7 A student team in a business statistics course designed an experiment to investigate whether the brand of bubblegum used affected the size of bubbles they could blow.To reduce the person-to- person variability, the students decided to use a randomized block design using themselves as blocks. Four brands of bubblegum were tested.A student chewed two pieces of a brand of gum and then blew a bubble, attempting to make it as big as possible.Another student measured the diameter of the bubble at its biggest point.The following table gives the diameters of the bubbles (in inches)for the 16 observations.
-Referring to Scenario 11-7, the value of MSA is __________, while MSBL is __________.
(Short Answer)
4.8/5 (39)
Filters
- Essay(0)
- Multiple Choice(0)
- Short Answer(0)
- True False(0)
- Matching(0)