Exam 20: Decision Making Online
Exam 1: Defining and Collecting Data207 Questions
Exam 2: Organizing and Visualizing Variables213 Questions
Exam 3: Numerical Descriptive Measures167 Questions
Exam 4: Basic Probability171 Questions
Exam 5: Discrete Probability Distributions217 Questions
Exam 6: The Normal Distributions and Other Continuous Distributions189 Questions
Exam 7: Sampling Distributions135 Questions
Exam 8: Confidence Interval Estimation189 Questions
Exam 9: Fundamentals of Hypothesis Testing: One-Sample Tests187 Questions
Exam 10: Two-Sample Tests208 Questions
Exam 11: Analysis of Variance216 Questions
Exam 12: Chi-Square and Nonparametric Tests178 Questions
Exam 13: Simple Linear Regression214 Questions
Exam 14: Introduction to Multiple Regression336 Questions
Exam 15: Multiple Regression Model Building99 Questions
Exam 16: Time-Series Forecasting173 Questions
Exam 17: Business Analytics115 Questions
Exam 18: A Roadmap for Analyzing Data329 Questions
Exam 19: Statistical Applications in Quality Management Online162 Questions
Exam 20: Decision Making Online129 Questions
Exam 21: Understanding Statistics: Descriptive and Inferential Techniques39 Questions
Select questions type
SCENARIO 20-6 A student wanted to find out the optimal strategy to study for a Business Statistics exam with scores out of 100 possible points.He constructed the following payoff table based on the mean amount of time he needed to study every week for the course and the degree of difficulty of the exam.From the information that he gathered from students who had taken the course, he concluded that there was a 40% probability that the exam would be easy. 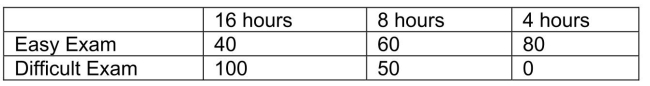 -Referring to Scenario 20-6, what is the maximum amount that the student is willing to pay to obtain perfect information?
(Short Answer)
4.7/5  (30)
(30)
SCENARIO 20-5 The following payoff table shows profits associated with a set of 2 alternatives under 3 possible events. 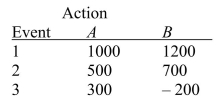 Suppose that the probability of Event 1 is 0.2, Event 2 is 0.5, and Event 3 is 0.3.
-Referring to Scenario 20-5, what is the opportunity loss for Action B with Event 3?
Suppose that the probability of Event 1 is 0.2, Event 2 is 0.5, and Event 3 is 0.3.
-Referring to Scenario 20-5, what is the opportunity loss for Action B with Event 3?
(Short Answer)
4.7/5 (38)
SCENARIO 20-6 A student wanted to find out the optimal strategy to study for a Business Statistics exam with scores out of 100 possible points.He constructed the following payoff table based on the mean amount of time he needed to study every week for the course and the degree of difficulty of the exam.From the information that he gathered from students who had taken the course, he concluded that there was a 40% probability that the exam would be easy.
-Referring to Scenario 20-6, how many possible courses of action are there?
(Short Answer)
4.8/5 (40)
SCENARIO 20-5 The following payoff table shows profits associated with a set of 2 alternatives under 3 possible events. Suppose that the probability of Event 1 is 0.2, Event 2 is 0.5, and Event 3 is 0.3.
-Referring to Scenario 20-5, what is the optimal action using the coefficient of variation?
(Short Answer)
4.7/5 (43)
SCENARIO 20-6 A student wanted to find out the optimal strategy to study for a Business Statistics exam with scores out of 100 possible points.He constructed the following payoff table based on the mean amount of time he needed to study every week for the course and the degree of difficulty of the exam.From the information that he gathered from students who had taken the course, he concluded that there was a 40% probability that the exam would be easy.
-Referring to Scenario 20-6, the optimal strategy using the expected opportunity loss criterion is to study 16 hours per week on average for the exam.
(True/False)
4.9/5 (34)
Blossom's Flowers purchases roses for sale for Valentine's Day.The roses are purchased for $10 a dozen and are sold for $20 a dozen.Any roses not sold on Valentine's Day can be sold for $5 per dozen.The owner will purchase 1 of 3 amounts of roses for Valentine's Day: 100, 200, or 400 dozen roses.The payoff for buying and selling 400 dozen roses at the full price is
(Multiple Choice)
4.9/5 (28)
SCENARIO 20-5 The following payoff table shows profits associated with a set of 2 alternatives under 3 possible events. Suppose that the probability of Event 1 is 0.2, Event 2 is 0.5, and Event 3 is 0.3.
-Referring to Scenario 20-5, what is the opportunity loss for Action B with Event 1?
(Short Answer)
4.7/5 (31)
SCENARIO 20-5 The following payoff table shows profits associated with a set of 2 alternatives under 3 possible events. Suppose that the probability of Event 1 is 0.2, Event 2 is 0.5, and Event 3 is 0.3.
-Referring to Scenario 20-5, what is the optimal action using EMV?
(Short Answer)
4.8/5 (37)
SCENARIO 20-5 The following payoff table shows profits associated with a set of 2 alternatives under 3 possible events. Suppose that the probability of Event 1 is 0.2, Event 2 is 0.5, and Event 3 is 0.3.
-Referring to Scenario 20-5, what is the optimal action using EOL?
(Short Answer)
4.8/5 (35)
SCENARIO 20-2 The following payoff matrix is given in dollars. 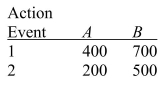 Suppose the probability of Event 1 is 0.5 and Event 2 is 0.5.
-Referring to Scenario 20-2, the EMV for Action A is
Suppose the probability of Event 1 is 0.5 and Event 2 is 0.5.
-Referring to Scenario 20-2, the EMV for Action A is
(Multiple Choice)
4.9/5 (39)
SCENARIO 20-6 A student wanted to find out the optimal strategy to study for a Business Statistics exam with scores out of 100 possible points.He constructed the following payoff table based on the mean amount of time he needed to study every week for the course and the degree of difficulty of the exam.From the information that he gathered from students who had taken the course, he concluded that there was a 40% probability that the exam would be easy.
-Referring to Scenario 20-6, the optimal strategy using the expected monetary value criterion is to study 8 hours per week on average for the exam.
(True/False)
4.8/5 (39)
SCENARIO 20-6 A student wanted to find out the optimal strategy to study for a Business Statistics exam with scores out of 100 possible points.He constructed the following payoff table based on the mean amount of time he needed to study every week for the course and the degree of difficulty of the exam.From the information that he gathered from students who had taken the course, he concluded that there was a 40% probability that the exam would be easy.
-Referring to Scenario 20-6, the optimal strategy using the return-to-risk ratio criterion is to study 8 hours per week on average for the exam.
(True/False)
4.8/5 (41)
SCENARIO 20-6 A student wanted to find out the optimal strategy to study for a Business Statistics exam with scores out of 100 possible points.He constructed the following payoff table based on the mean amount of time he needed to study every week for the course and the degree of difficulty of the exam.From the information that he gathered from students who had taken the course, he concluded that there was a 40% probability that the exam would be easy.
-Referring to Scenario 20-6, the optimal strategy using the expected opportunity loss criterion is to study 8 hours per week on average for the exam.
(True/False)
4.7/5 (35)
At Eastern University, 60% of the students are from suburban areas, 30% are from rural areas, and 10% are from urban areas.Of the students from the suburban areas, 60% are nonbusiness majors.Of the students from the rural areas, 70% are nonbusiness majors.Of the students from the urban areas, 90% are nonbusiness majors.The probability that a randomly selected student is a business major is
(Multiple Choice)
4.8/5 (37)
SCENARIO 20-6 A student wanted to find out the optimal strategy to study for a Business Statistics exam with scores out of 100 possible points.He constructed the following payoff table based on the mean amount of time he needed to study every week for the course and the degree of difficulty of the exam.From the information that he gathered from students who had taken the course, he concluded that there was a 40% probability that the exam would be easy.
-Referring to Scenario 20-6, the optimal strategy using the maximin criterion is to study 16 hours per week on average for the exam.
(True/False)
4.9/5 (42)
SCENARIO 20-5 The following payoff table shows profits associated with a set of 2 alternatives under 3 possible events. Suppose that the probability of Event 1 is 0.2, Event 2 is 0.5, and Event 3 is 0.3.
-Referring to Scenario 20-5, what is the optimal action using maximax criterion?
(Short Answer)
4.8/5 (42)
SCENARIO 20-2 The following payoff matrix is given in dollars. Suppose the probability of Event 1 is 0.5 and Event 2 is 0.5.
-Referring to Scenario 20-2, what is the optimal action using the EOL criterion?
(Multiple Choice)
4.8/5 (36)
SCENARIO 20-6 A student wanted to find out the optimal strategy to study for a Business Statistics exam with scores out of 100 possible points.He constructed the following payoff table based on the mean amount of time he needed to study every week for the course and the degree of difficulty of the exam.From the information that he gathered from students who had taken the course, he concluded that there was a 40% probability that the exam would be easy.
-Referring to Scenario 20-6, what is the expected opportunity loss of spending 8 hours per week on average studying for the exam?
(Short Answer)
4.8/5 (45)
SCENARIO 20-5 The following payoff table shows profits associated with a set of 2 alternatives under 3 possible events. Suppose that the probability of Event 1 is 0.2, Event 2 is 0.5, and Event 3 is 0.3.
-Referring to Scenario 20-5, what is the expected profit under certainty (EPUC )for this problem?
(Short Answer)
4.8/5 (41)
Filters
- Essay(0)
- Multiple Choice(0)
- Short Answer(0)
- True False(0)
- Matching(0)