Exam 10: Population Dynamics
Exam 1: The Web of Life68 Questions
Exam 2: The Physical Environment76 Questions
Exam 3: The Biosphere73 Questions
Exam 4: Coping With Environmental Variation:74 Questions
Exam 5: Coping With Environmental Variation: Energy71 Questions
Exam 6: Evolution and Ecology68 Questions
Exam 7: Life History69 Questions
Exam 8: Behavioral Ecology71 Questions
Exam 9: Population Distribution and Abundance80 Questions
Exam 10: Population Dynamics68 Questions
Exam 11: Population Growth and Regulation69 Questions
Exam 12: Predation70 Questions
Exam 13: Parasitism72 Questions
Exam 14: Competition74 Questions
Exam 15: Mutualism and Commensalism71 Questions
Exam 16: The Nature of Communities71 Questions
Exam 17: Change in Communities73 Questions
Exam 18: Biogeography70 Questions
Exam 19: Species Diversity in Communities72 Questions
Exam 20: Production73 Questions
Exam 21: Energy Flow and Food Webs76 Questions
Exam 22: Nutrient Supply and Cycling76 Questions
Exam 23: Conservation Biology73 Questions
Exam 24: Landscape Ecology and Ecosystem Management71 Questions
Exam 25: Global Ecology74 Questions
Select questions type
Refer to the figures.
Figure 1
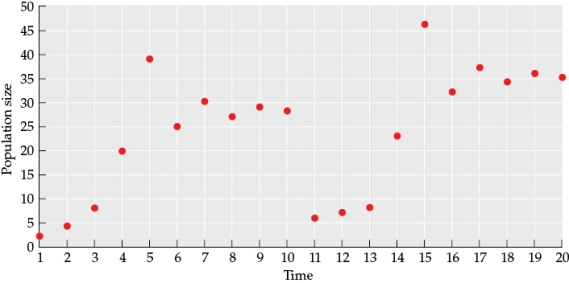 Figure 2
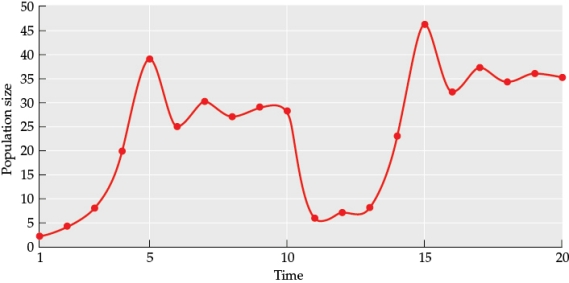 -What happened to the population between time 10 and 11? Based on the data prior to this point, what type of event most likely caused the change in the population size seen at that time? What additional data would you need to determine the underlying cause of the event?
(Essay)
4.9/5  (34)
(34)
Which of the following is not an observed pattern of population growth observed in nature?
(Multiple Choice)
4.8/5 (44)
Which of the following helped the Black Sea recover during the 1990s?
(Multiple Choice)
4.8/5 (37)
A population of wolves predates a population of moose on Isle Royale, Michigan, where there are fewer wolves than moose to start. The wolves prey on the moose and eat well, allowing them to have abundant offspring. However, as the wolf population rises, the moose population drops, and over time, the wolf population begins to drop also because of the reduced availability of resources. As the wolf population drops, moose are able to better survive and reproduce, causing the moose population to rise. With this abundance of moose, the wolf population is able to rebound until their population exceeds the moose population's ability to support the number of wolves. Which population dynamic does this series of oscillations represent?
(Multiple Choice)
4.8/5 (37)
Which of the following would be an example of genetic drift?
(Multiple Choice)
4.8/5 (46)
Assuming that their average population growth rates and all other factors are equal, which population would most likely be at risk for extinction?
(Multiple Choice)
4.8/5 (38)
Which equation best describes the pattern of population dynamics of the sheep in Tasmania from their introduction to the present day?
(Multiple Choice)
4.8/5 (28)
Filters
- Essay(0)
- Multiple Choice(0)
- Short Answer(0)
- True False(0)
- Matching(0)