Exam 10: Population Dynamics
Exam 1: The Web of Life68 Questions
Exam 2: The Physical Environment76 Questions
Exam 3: The Biosphere73 Questions
Exam 4: Coping With Environmental Variation:74 Questions
Exam 5: Coping With Environmental Variation: Energy71 Questions
Exam 6: Evolution and Ecology68 Questions
Exam 7: Life History69 Questions
Exam 8: Behavioral Ecology71 Questions
Exam 9: Population Distribution and Abundance80 Questions
Exam 10: Population Dynamics68 Questions
Exam 11: Population Growth and Regulation69 Questions
Exam 12: Predation70 Questions
Exam 13: Parasitism72 Questions
Exam 14: Competition74 Questions
Exam 15: Mutualism and Commensalism71 Questions
Exam 16: The Nature of Communities71 Questions
Exam 17: Change in Communities73 Questions
Exam 18: Biogeography70 Questions
Exam 19: Species Diversity in Communities72 Questions
Exam 20: Production73 Questions
Exam 21: Energy Flow and Food Webs76 Questions
Exam 22: Nutrient Supply and Cycling76 Questions
Exam 23: Conservation Biology73 Questions
Exam 24: Landscape Ecology and Ecosystem Management71 Questions
Exam 25: Global Ecology74 Questions
Select questions type
Refer to the figure.
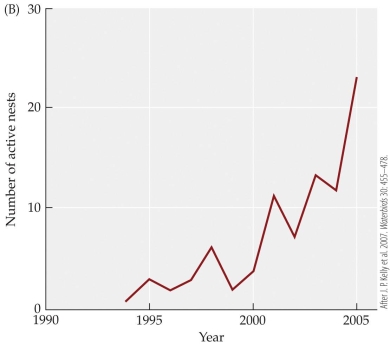 What type of growth does this population appear to be showing?
(Multiple Choice)
4.8/5  (36)
(36)
In the 1950s, Nicholson's experiments with blowflies showed that delayed density dependence can produce population cycles. If the experimental subjects in these studies had been blowflies with somewhat lower growth rates, he most likely would have observed which pattern of population dynamics?
(Multiple Choice)
4.8/5 (41)
Refer to the figure.
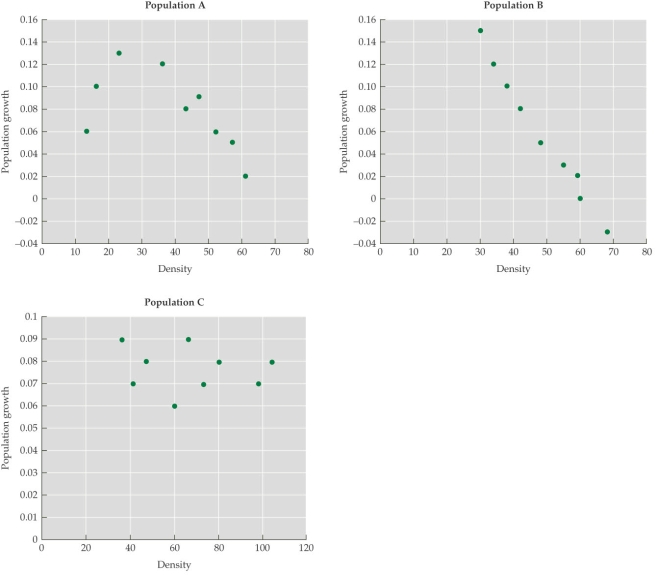 The figure is derived from studies of the populations and per-individual growth rates of three species of rodents in the U.S. desert southwest. According to the figure, which population(s) show(s) evidence of Allee effects?
(Multiple Choice)
4.9/5 (39)
Nicholson (1957) found that when adult sheep blowfly populations are high, egg production by blowflies
(Multiple Choice)
4.9/5 (36)
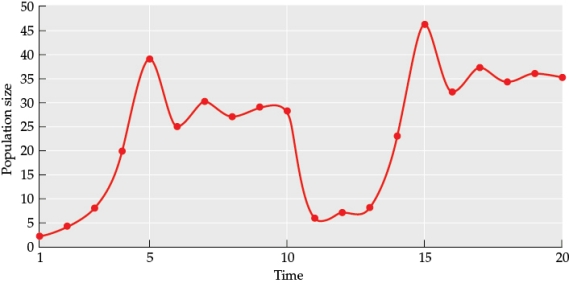
Refer to the figure.
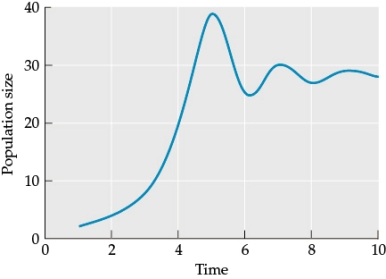 Based on the data in the figure, what is the carrying capacity in this environment?
(Multiple Choice)
4.8/5 (32)
Refer to the figure.
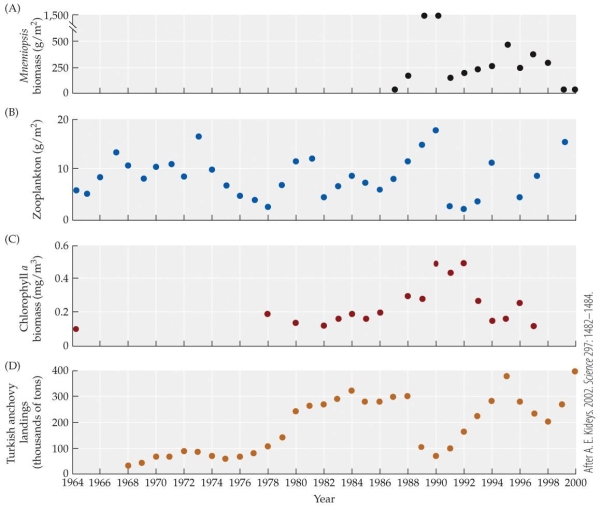 -Between 1988 and 1990, the Turkish anchovy population was _______ and the zooplankton population was _______.
(Multiple Choice)
4.7/5 (50)
Consider a population of birds that land on an island. Their numbers rise exponentially until they reach a population of 1,000 birds, after which they crash to 700 due to resource limitations. Over time, the population rises and falls until it stabilizes around a population of 850. What does this population size likely represent in terms of population growth?
(Multiple Choice)
4.8/5 (32)
Which pattern of population dynamics best describes that exhibited by collared lemmings in Greenland?
(Multiple Choice)
4.9/5 (30)
Refer to the figures.
Figure 1
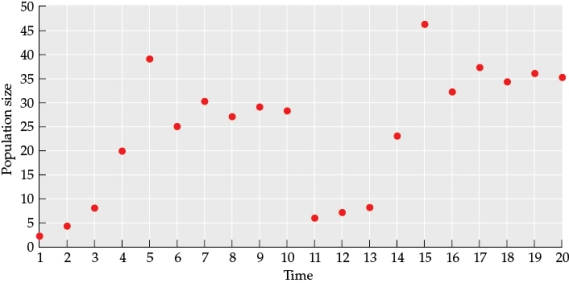 Figure 2
 - How did the genetic diversity of this population change over time? How diverse do you think the initial population was, and how diverse do you think the population was after time 11? How would you describe the overall genetic diversity of this population?
(Essay)
4.9/5 (38)
Refer to the figures.
Figure 1
 Figure 2
 - What is the carrying capacity (K) of the population prior to the event that occurred between times 10 and 11? What is the carrying capacity after the event? Why is the carrying capacity different for these times? What could have caused this change?
(Essay)
4.8/5 (33)
Which of the following could be considered the opposite of the density dependence seen in the standard logistic equation?
(Multiple Choice)
4.7/5 (40)
Which of the following is an extreme case of population fluctuations?
(Multiple Choice)
4.9/5 (29)
Refer to the figures.
Figure 2
 Figure 4
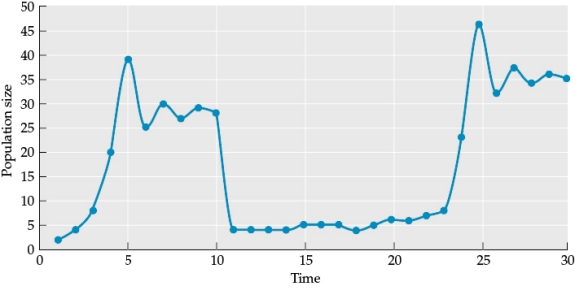 In which figure, Figure 2 or Figure 4, is the population at greater risk of extinction? Why?
(Essay)
4.9/5 (34)
Refer to the figure.
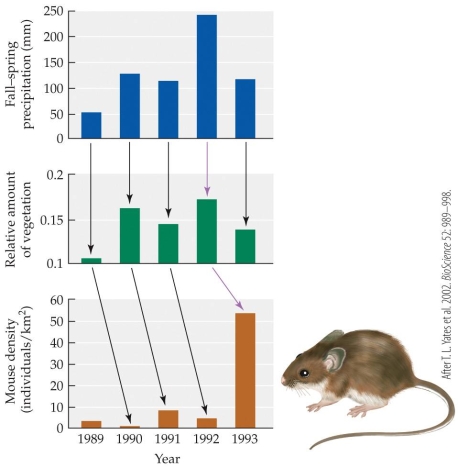 What was the ultimate cause of the increase in mouse density according to this figure?
(Multiple Choice)
4.8/5 (39)
Lionfish (Pterois spp.) arrived in the Caribbean in the 1980s, most likely as a result of unintentional release. On the island of Bonaire, Municipality of the Netherlands, the lionfish population exploded initially, but over time, appeared to stabilize. Part of the reason for this stabilization was the popularity of spear fishing. As the population of lionfish at shallow depths (5-30 meters) were vastly reduced by spear fishing, the popularity of hunting lionfish declined. Over time, the lionfish recovered and spearfishing recommenced. Another possible reason for the lionfish population's decline is an emerging ulcerative skin disease. Use this story of Bonaire to discuss the following types of observed patterns of population growth: exponential growth, logistic growth, and regular population cycles.
(Essay)
4.9/5 (43)
Suppose a population of weevils that experiences logistic growth has an initial size of 1,563 and follows the standard equation for delayed density dependence with a 5-week delay and an intrinsic growth rate of 0.15 per week. If these conditions remain constant and the population is tracked for a long time, what type of population dynamics should it display? (Note: The cutoff r value for dampened oscillations is 0.368, and the cutoff for a stable limit cycle is 1.57.)
(Multiple Choice)
4.8/5 (33)
Refer to the figure.
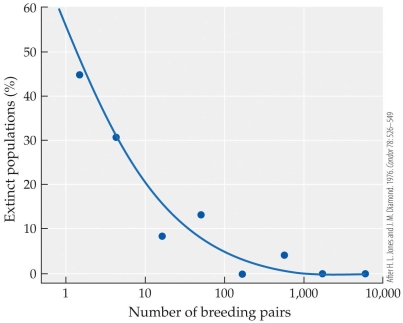 Based on the figure, extinction was a possible outcome for _______ breeding pairs.
(Multiple Choice)
4.9/5 (39)
Filters
- Essay(0)
- Multiple Choice(0)
- Short Answer(0)
- True False(0)
- Matching(0)