Exam 10: Nonlinear Optimization Models
Exam 1: Introduction30 Questions
Exam 2: Descriptive Statistics60 Questions
Exam 3: Data Visualization61 Questions
Exam 4: Linear Regression60 Questions
Exam 5: Time Series Analysis and Forecasting58 Questions
Exam 6: Data Mining60 Questions
Exam 7: Spreadsheet Models60 Questions
Exam 8: Linear Optimization Models60 Questions
Exam 9: Integer Linear Optimization Models60 Questions
Exam 10: Nonlinear Optimization Models60 Questions
Exam 11: Monte Carlo Simulation59 Questions
Exam 12: Decision Analysis60 Questions
Select questions type
In the Bass forecasting model, the _____ measures the likelihood of adoption due to a potential adopter being influenced by someone who has already adopted the product.
(Multiple Choice)
4.8/5  (42)
(42)
In the Bass forecasting model, the _____ measures the likelihood of adoption, assuming no influence from someone who has already purchased (adopted) the product.
(Multiple Choice)
4.8/5 (34)
Consider the objective function,
where,
Y = total output
A= total-factor productivity
L = labor input
K= capital input
α = capital input share of contribution for L
β = capital input share of contribution for K
a. Assume α = 0.33, β = 0.67, A = 10 and each unit of labor costs $45 and each unit of capital costs $55. With $50,000 available in the budget, develop an optimization model to determine the number of units of capital and labor required in order to maximize output.
b. Find the optimal solution to the model you formulated in part a. Round all your answers to two decimal places. (Hint: When using Excel Solver, use the Multistart option with bounds 0 ≤ L ≤ 700 and 0 ≤ K ≤ 1000.)
(Essay)
4.9/5 (36)
Jim is trying to solve a problem where point A should be within the radius of 15cms from the points B, C, D, E and F. The decision variables are defined as below.
X = horizontal coordinate of point A
Y = vertical coordinate of point A
The data on the distances is given below:
 Formulate a model to find the optimal location of the point A.
(Essay)
4.8/5 (37)
If there are no other feasible points with a larger objective function value in the entire feasible region, a feasible solution is _____.
(Multiple Choice)
5.0/5 (33)
The manager of a supermarket estimates the average number of trips made to the warehouse from each of the 5 outlets and he wants the warehouse to be closer to the outlets which has high number of average trips. The available data on the distance between the warehouse and the outlets are provided in terms of horizontal and vertical distances. That is, X = horizontal coordinate of the warehouse; and Y = vertical coordinate of the warehouse. The data is shown below.
 a. Develop a new unconstrained model that minimizes the sum of the demand-weighted distance defined as the product of the demand (measured in number of trips) and the distance to the warehouse.
b. Solve the model you developed in part a.
a. Develop a new unconstrained model that minimizes the sum of the demand-weighted distance defined as the product of the demand (measured in number of trips) and the distance to the warehouse.
b. Solve the model you developed in part a.
(Essay)
4.7/5 (42)
A function that is bowl-shaped up is called a(n) _____ function.
(Multiple Choice)
4.8/5 (33)
A function that is bowl-shaped down is called a _____ function.
(Multiple Choice)
4.8/5 (36)
Reference - 10.3: Use the graph given below to answer questions
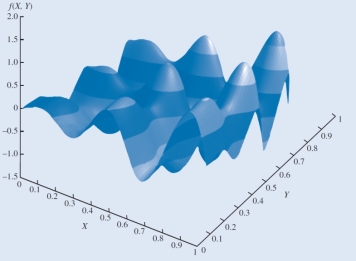 -Reference - 10.3. Which of the following is true of the above function?
(Multiple Choice)
4.9/5 (31)
Consider the following data on the returns from bonds:
 Develop and solve the Markowitz portfolio model using a required expected return of at least 15 percent. Assume that the 8 scenarios are equally likely to occur. Use this model to construct an efficient frontier by varying the expected return from 2 to 18 percent in increment of 2 percent and solving for the variance. Round all your answers to three decimal places.
(Essay)
4.9/5 (40)
Roger is willing to promote and sell two types of smart watches, X and Y, at his outlet. The demand for these two watches are as follows:
DX = -0.45PX + 0.34PY + 242
DY = 0.2PX - 0.58PY + 282
where, DX is the demand for watch X, PX is the selling price of watch X, DY is the demand for watch Y, and PY is the selling price of watch Y.
Rogers wishes to determine the selling price that maximizes revenue for these two products. Develop the revenue function for these two models, and find the revenue maximizing prices.
(Essay)
4.7/5 (43)
Reference - 10.3: Use the graph given below to answer questions
-Reference - 10.3. Which of the following equations is most likely to yield the above curve?
(Multiple Choice)
4.8/5 (31)
Mark and his friends are planning for a holiday party. Data on longitude, latitude, and number of friends at each of the 10 locations are given below. Mark would like to identify the location for the holiday party such that it minimizes the demand-weighted distance, where demand is the number of friends at each location. Find the optimal location for the party. The distance between two cities can be approximated by the following formula
where lat1 and long1 are the latitude and longitude of city 1, and lat2 and long2 are the latitude and longitude of city 2. (Hint: Notice that all longitude values given for this problem are negative. Make sure that you do not check the option for Make Unconstrained Variables Non-Negative in Solver.)

(Essay)
4.7/5 (35)
Consider the stock return data given below.
 Develop and solve the Markowitz model that maximizes expected return subject to a maximum variance of 35. Use this model to construct an efficient frontier by varying the maximum allowable variance from 25 to 55 in increments of 5 and solving for the maximum return for each.
(Essay)
4.8/5 (32)
If there are no other feasible solutions with a larger objective function value in the immediate neighborhood, then the feasible solution is known as _____.
(Multiple Choice)
4.7/5 (31)
Reference - 10.2: Use the graph given below to answer questions
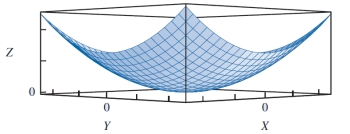 -Reference - 10.2. What is the minimum value for this function?
(Multiple Choice)
4.8/5 (27)
Reference - 10.3: Use the graph given below to answer questions
-Reference - 10.3. The feasible region for the function represented in the graph is:
(Multiple Choice)
4.8/5 (31)
Gatson manufacturing company is willing to promote 2 types of tires: Economy tire; Premium tire, and these two tires are independent of each other in terms of demand, cost, price, etc. An analytics team of this company has estimated the profit functions for both the tires as,
Monthly profit for Economy tire = 49.2415 LN(XA) + 180.414
Monthly profit for Premium tire = 84.344 LN(XB) - 150.112
where XA and XB are the advertising amount allocated to Economy tire and Premium tire, respectively, and LN is the natural logarithm function. The advertising budget is $200,000, and management has dictated that at least $20,000 must be allocated to each of the two tires.
(Hint: To compute a natural logarithm for the value X in Excel, use the formula =LN(X). For Solver to find an answer, you also need to start with decision variable values greater than 0 in this problem.)
Develop and solve an optimization model that will prescribe how the company should allocate its marketing budget to maximize profit.
(Essay)
4.8/5 (35)
Reference - 10.1: Use the graph given below to answer questions
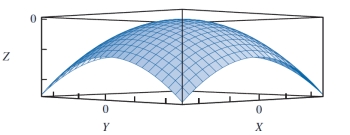 -Reference - 10.1. The point (0, 0) is a(n) _____ for the given concave function.
(Multiple Choice)
4.7/5 (38)
Filters
- Essay(0)
- Multiple Choice(0)
- Short Answer(0)
- True False(0)
- Matching(0)