Exam 10: Nonlinear Optimization Models
Exam 1: Introduction30 Questions
Exam 2: Descriptive Statistics60 Questions
Exam 3: Data Visualization61 Questions
Exam 4: Linear Regression60 Questions
Exam 5: Time Series Analysis and Forecasting58 Questions
Exam 6: Data Mining60 Questions
Exam 7: Spreadsheet Models60 Questions
Exam 8: Linear Optimization Models60 Questions
Exam 9: Integer Linear Optimization Models60 Questions
Exam 10: Nonlinear Optimization Models60 Questions
Exam 11: Monte Carlo Simulation59 Questions
Exam 12: Decision Analysis60 Questions
Select questions type
If all the squared terms in a quadratic function have a negative coefficient and there are no cross-product terms, then the function is a _____ function.
(Multiple Choice)
4.8/5  (38)
(38)
A feasible solution is _____ if there are no other feasible points with a better objective function value in the entire feasible region.
(Multiple Choice)
4.7/5 (35)
A feasible solution is _____ if there are no other feasible points with a smaller objective function value in the entire feasible region.
(Multiple Choice)
4.9/5 (30)
The _____ of a solution is a mathematical concept that refers to the set of points within a relatively close proximity of the solution.
(Multiple Choice)
4.9/5 (37)
A(n) _____ is a set of points defining the minimum possible risk for a set of return values.
(Multiple Choice)
4.9/5 (30)
Jim is trying to solve a problem where the point A should be within the radius of 15cms from points B, C, D, E, and F. The decision variables are defined as below.
X = horizontal coordinate of point A
Y = vertical coordinate of point A
The data on the distances is given below:
 Formulate and solve a model that minimizes the maximum distance from point A to each of the points B, C, D, E, and F. Round all your answers to three decimal places.
(Essay)
4.8/5 (40)
A _____ is the shadow price of a binding simple lower or upper bound on the decision variable.
(Multiple Choice)
4.7/5 (41)
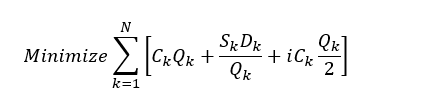
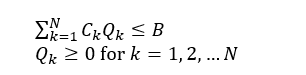
Consider the EOQ model for multiple products that are independent except for a budget restriction. The following model describes this situation:
Let Dk = annual demand for product k
Ck = unit cost of product k
Sk = cost per order placed for product k
i = inventory carrying charge as a percentage of the cost per unit
B = the maximum amount of investment in goods
N = number of products
The decision variables are Qk, the amount of product k to order. The model is:
 s.t.
s.t.
 a. Set up a spreadsheet model and for the following data:
 b. Solve the problem using Excel Solver. (Hint: For Solver to find a solution, you need to start with decision variable values that are greater than 0.)
(Essay)
4.8/5 (33)
An Electrical Company has two manufacturing plants. The cost in dollars of producing an Amplifier at each of the two plants is given below. The cost of producing Q1 Amplifiers at first plant is:
65Q₁ + 4Q₁²+ 90
and the cost of producing Q₂ Amplifiers at the second plant is
20Q₂ + 2Q₂²+ 120
The company needs to manufacture at least 60 Amplifiers to meet the received orders. How many Amplifiers should be produced at each of the plant to minimize the total production cost? Round the answers to two decimal places and the total cost to the nearest dollar value.
(Essay)
4.9/5 (41)
Develop a model that minimizes semivariance for the data given below with a required return of 15 percent. Define a variable ds for each scenario and let ds≥R-Rs with ds ≥ 0. Then make the objective function: Min 14s=14ds2.
 Solve the model you developed with a required expected return of at least 15 percent.
(Essay)
4.9/5 (32)
A portfolio optimization model used to construct a portfolio that minimizes risk subject to a constraint requiring a minimum level of return is known as_____.
(Multiple Choice)
4.8/5 (29)
Consider the following data on the returns from bonds:
 Develop and solve the Markowitz portfolio model using a required expected return of at least 15 percent. Assume that the 8 scenarios are equally likely to occur. Use this model to construct an efficient frontier by varying the expected return from 2 to 18 percent in increment of 2 percent and solving for the variance. Round all your answers to three decimal places.
(Essay)
4.7/5 (31)
Which of the following conclusions can be drawn from the below figure using the Bass forecasting model? (Note: Bass forecasting model is given by: Ft = (p + q[Ct - ₁ /m]) (m - Ct - ₁),
Where m = the number of people estimated to eventually adopt the new product,
Ct - ₁ = the number of people who have adopted the product through time t - 1,
Q = the coefficient of imitation, and
P = the coefficient of innovation.)
![Which of the following conclusions can be drawn from the below figure using the Bass forecasting model? (Note: Bass forecasting model is given by: F<sub>t</sub> = (p + q[C<sub>t</sub> - ₁ /m]) (m - C<sub>t</sub> - ₁), Where m = the number of people estimated to eventually adopt the new product, C<sub>t</sub> - ₁ = the number of people who have adopted the product through time t - 1, Q = the coefficient of imitation, and P = the coefficient of innovation.)](https://storage.examlex.com/TB1880/11ea4021_0f0f_718b_b5a8_5175fdb9a7ea_TB1880_00.jpg)
(Multiple Choice)
4.8/5 (28)
Solving nonlinear problems with local optimal solutions is performed using _____, in Excel Solver, which is based on more classical optimization techniques.
(Multiple Choice)
4.8/5 (40)
A feasible solution is a local minimum if there are no other feasible solutions with a:
(Multiple Choice)
4.8/5 (33)
Excel Solver's _____ is based on a method that searches for an optimal solution by iteratively adjusting a population of candidate solutions.
(Multiple Choice)
5.0/5 (26)
Consider the data on investment made in four types of funds and returns from S&P 500.
 a. Develop an optimization model that will give the fraction of the portfolio to invest in each of the funds so that the return of the resulting portfolio matches as closely as possible the return of the S&P 500 Index. (Hint: Minimize the sum of the squared deviations between the portfolio's return and the S&P 500 Index return for each year in the data set.)
b. Solve the model developed in part a.
a. Develop an optimization model that will give the fraction of the portfolio to invest in each of the funds so that the return of the resulting portfolio matches as closely as possible the return of the S&P 500 Index. (Hint: Minimize the sum of the squared deviations between the portfolio's return and the S&P 500 Index return for each year in the data set.)
b. Solve the model developed in part a.
(Essay)
4.7/5 (39)
Filters
- Essay(0)
- Multiple Choice(0)
- Short Answer(0)
- True False(0)
- Matching(0)