Exam 32: Variability in Samples
Exam 1: Reasoning About Quantities34 Questions
Exam 2: Numeration Systems96 Questions
Exam 3: Understanding Whole Number Operations66 Questions
Exam 4: Some Conventional Ways of Computing17 Questions
Exam 5: Using Numbers in Sensible Ways38 Questions
Exam 6: Meanings for Fractions85 Questions
Exam 7: Computing With Fractions54 Questions
Exam 8: Multiplicative Comparisons and Multiplicative Reasoning19 Questions
Exam 9: Ratios, Rates, Proportions, and Percents33 Questions
Exam 10: Integers and Other Number Systems24 Questions
Exam 11: Number Theory57 Questions
Exam 12: What Is Algebra28 Questions
Exam 13: A Quantitative Approach to Algebra and Graphing18 Questions
Exam 14: Understanding Change: Relationships Among Time, Distance, and Rate10 Questions
Exam 15: Further Topics in Algebra and Change55 Questions
Exam 16: Polygons75 Questions
Exam 17: Polyhedra51 Questions
Exam 18: Symmetry17 Questions
Exam 19: Tessellations9 Questions
Exam 20: Similarity47 Questions
Exam 21: Curves, Constructions, and Curved Surfaces17 Questions
Exam 22: Transformation Geometry24 Questions
Exam 23: Measurement Basics21 Questions
Exam 24: Area, Surface Area, and Volume27 Questions
Exam 25: Counting Units Fast: Measurement Formulas31 Questions
Exam 26: Special Topics in Measurement21 Questions
Exam 27: Quantifying Uncertainty39 Questions
Exam 28: Determining More Complicated Probabilities37 Questions
Exam 29: Introduction to Statistics and Sampling7 Questions
Exam 30: Representing and Interpreting Data With One Variable32 Questions
Exam 31: Dealing With Multiple Data Sets or With Multiple Variables8 Questions
Exam 32: Variability in Samples21 Questions
Exam 33: Special Topics in Probability16 Questions
Select questions type
A) Suppose we took a random sample of 400 statewide voters and asked whether they would raise taxes to support schools more. Suppose 55% say they would. What (numerically) can be said about the percent of all voters in the state who would raise taxes?
B) What is the confidence level associated with your answer in part A?
C) In a pie chart (circle graph) for the data in part A, how many degrees would these positive responses get? Which choice below is correct? Write enough (numbers or words) to make your thinking clear.
i.
ii. 73
iii.
iv.
Free
(Essay)
4.8/5  (22)
(22)
Correct Answer: Verified
A) There is a pretty good chance that the percent of the population favoring the tax increase is in the 50% to 60% interval.
B) "Pretty good" would be about a 95% confidence level. (Note: This may not come up in all classes.)
C) iii. 198° (55% of 360°)
A report says that 80% of the children are overweight. Which of the following is more likely to happen? Explain your answer.
A) Five children are weighed, and three are overweight.
B) One hundred children are weighed, and 60 are overweight.
Free
(Essay)
4.8/5 (39)
Correct Answer:Verified
Choice A is more likely since the larger sample in B should give an estimate closer to 80%.
Suppose that population A has 10 million items. If a sample of size 2000 is used, then a sample of size 4000 would give twice as much confidence in the result. Explain your decision.
Free
(True/False)
4.8/5 (34)
Correct Answer:Verified
False
The Federal Trade Commission studied 300 ads for diets and diet aids and found that 55% made at least one misleading claim. Give a confidence interval for the percentage of diet or diet aid ads that contain misleading claims. Show your work.
(Essay)
4.7/5 (24)
A radio report says, "Only 40% of the children are physically fit." Which scenario would be more likely to happen (or equally likely)? Explain your answer.
A) Ten children are tested, and seven are physically fit.
B) Fifty children are tested, and 35 are physically fit.
(Essay)
4.8/5 (32)
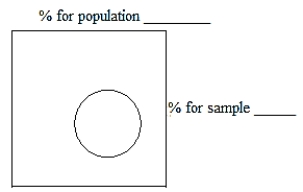
"Based on the test score average of 85% at Washington Elementary School, I would say scores for the whole district are in the 82% to 88% range, with 95% confidence."
A) Why does the person say, "Scores for the whole district will be in the 82% to 88% range," rather than give a definite percent?
B) Using the quote, put the correct percents for test score average in the blanks to the right in the diagram below.
(Essay)
4.8/5 (31)
Which answer BEST explains of the meaning of the following statement?
"Based on the results in our survey, a confidence interval from 30% to 38% has a 90% confidence level."
(Multiple Choice)
4.8/5 (42)
You hire 100 people to survey the city's residents about the question, "Do you approve of the job the mayor is doing?" Each person interviews 25 people. They report back, and here is a tabulation of the 100 samples.
Number of samples (of 100 samples of 25 each) giving indicated sample percents
A) From the data above, give a good estimate of the percent of the whole population who are for the mayor. Explain your decision. Percent of sample who are for the mayor Number of samples 48\% 1 sample 44\% 4 samples 40\% 5 samples 36\% 4 samples 32\% 14 samples 28\% 21 samples 24\% 19 samples 20\% 16 samples 16\% 11 samples 12\% 2 samples 8\% 3 samples
A) From the data above, give a good estimate of the percent of the whole population who are for the mayor. Explain your decision.
B) Using the table above, give a confidence interval for the percentage of people in the population who are for the mayor. Your confidence interval should have a 90% confidence level.With a 90% confidence level:
C) Why is the idea not good here?
D) If there were an added column for 100 samples, each sample of size 100, how would the column look compared to the column for samples of size 25?
(Essay)
4.9/5 (41)
You hire 100 people to survey city residents about the question, "Do you think the county park should be closed in order to resolve the budget crisis?" Each person interviews 25 people. They report back, and here is a tabulation of the 100 samples.
Number of 100 samples giving indicated sample percents Number of 100 samples giving indicated sample percents Percent of sample who are for the closing Number of samples of size 25 12\% 2 samples 16\% 3 samples 20\% 6 samples 24\% 7 samples 28\% 13 samples 32\% 19 samples 36\% 18 samples 40\% 14 samples 44\% 13 samples 48\% 3 samples 52\% 2 samples
A) From the data above, give a good estimate of the percent of the whole population who are for closing the park. Explain your decision.
B) Give a 90% confidence interval for the percentage of people in the population who favor the county park closing. Use the table, rather than the idea. With a 90% confidence interval:
C) Why is the idea not good here?
D) If there were an added column for 100 samples, each sample of size 100, how would the column look compared to the column for samples of size 25?
(Essay)
4.7/5 (37)
A) Suppose we took a random sample of 400 statewide voters and asked whether they would raise taxes to support schools more. Suppose 45% say they would. What (numerically) can be said about the percent of all voters who would raise taxes?
B) What is the confidence level associated with your answer in part A?
C) In a pie chart (circle graph) for the data in part A, how many degrees would these positive responses get? Which choice below is correct? Write enough (numbers or words) to make your thinking clear.
i.
ii.
iii.
iv.
(Essay)
4.8/5 (40)
You hire 100 people to survey city residents about the question, "Do you approve of a new stadium for the football team?" Each person interviews 100 people. They report back, and here is a tabulation of the 100 samples.
A) One of the people sees the table and says, "Oh! So the percent of all the residents who approve is definitely 34%, just like in my sample!" What do you say? \multicolumn 1 |c| Percent of sample who approve Number of samples 39\% 4 samples 38\% 1 samples 37\% 11 samples 36\% 20 samples 35\% 19 samples 34\% 25 samples 33\% 15 samples 32\% 1 samples 31\% 2 samples 30\% 1 samples 29\% 1 samples A) One of the people sees the table and says, "Oh! So the percent of all the residents who approve is definitely 34%, just like in my sample!" What do you say?
B) Using the table above, give a confidence interval for the percentage of people in the population who approve. Your confidence interval should have a 90% confidence level.
Confidence interval:
C) Why is the idea not good here?
D) If there were an added column for 100 samples, each sample of size 200, how would the column look compared to the column for samples of size 100?
(Essay)
4.9/5 (37)
State candidate X's headquarters has had local groups run polls in large cities. In City A, 486 of 900 voters polled said that they would vote for X. In City B, 56 of 100 voters polled said that they would vote for X. Headquarters has some more money to spend on advertising in City A and/or City B, and they think they should do it in City
A. However, they have decided to consult you. Should they spend more campaign money in City A or City B? Explain.
(Essay)
4.7/5 (34)
A) A random sample of 40 university graduates showed that 55% earned at least $45,000 a year. Give a confidence interval for the percentage of university graduates who earn at least $45,000 a year.
B) If you take a larger sample size in A, will your confidence interval be longer or shorter?
(Essay)
4.9/5 (39)
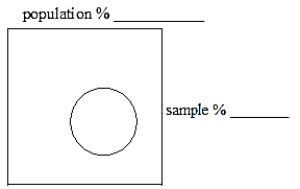
"With our survey showing 75% for, we are 95% confident that 71% to 79% will vote for."
A) What does the statement in quotes mean?
B) Using the quote, put the correct percents for "for" votes in the blanks to the right of the labels in the diagram below.
(Essay)
4.9/5 (38)
A radio report says, "Only 40% of the children are physically fit." Which sample size would be the more informative one to test the statement?
(Multiple Choice)
4.8/5 (35)
A larger sample gives a larger confidence interval for the percent of "yeses."
(True/False)
4.9/5 (38)
A survey concludes, "So with a confidence level of 95%, our figures show that only 48% of the people, ± 5%, prefer Brand X."
A) What does the statement mean?
B) About how many people did they survey?
(Essay)
4.8/5 (42)
In testing a life-or-death drug, a company increased its sample size from 25 to 100 before asking for Food and Drug Administration approval. Why would they do this?
(Essay)
4.8/5 (31)
"With our survey showing 65% for, we are 95% confident that 61% to 69% will vote for."
A) What does the statement in quotes mean?
B) Using the quote, put the correct percents for "for" votes in the blanks to the right of the labels in the diagram below.

(Essay)
4.8/5 (49)
Filters
- Essay(0)
- Multiple Choice(0)
- Short Answer(0)
- True False(0)
- Matching(0)