Exam 10: Data Description and Probability Distributions
Exam 1: Linear Equations and Graphs59 Questions
Exam 2: Functions and Graphs178 Questions
Exam 3: Mathematics of Finance57 Questions
Exam 4: Systems of Linear Equations; Matrices115 Questions
Exam 5: Linear Inequalities and Linear Programming26 Questions
Exam 6: Linear Programming: The Simplex Method58 Questions
Exam 7: Logic, Sets, and Counting51 Questions
Exam 8: Probability59 Questions
Exam 9: Markov Chains60 Questions
Exam 10: Data Description and Probability Distributions65 Questions
Exam 11: Games and Decisions52 Questions
Exam 12: Appendix A: Basic Algebra Review45 Questions
Exam 13: Appendix B: Special Topics20 Questions
Select questions type
Use the rule-of-thumb test to check whether a normal distribution (with the same mean and standard deviation as the binomial distribution) is a suitable approximation for the binomial distribution with given the properties:
-n = 20, p = .8
(True/False)
5.0/5  (44)
(44)
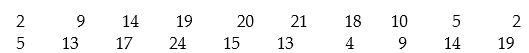
Construct a frequency table:
-The following is the number of hours students studied per week on average. Use five intervals, starting with 0 - 4.
(Multiple Choice)
4.9/5 (31)
A botanist wants to grow a rare plant in his greenhouse. The probability that a given bulb will mature is 0.42. Suppose 6 bulbs are planted.(A) Write the probability function defining this distribution.(B) What is the probability that 3 or more bulbs will mature?(Round your answer to three decimal places.)
(Short Answer)
4.8/5 (38)
Find the mode for the data set:
2, 11, 35, 2, 9, 35, 11, 9, 7, 2, 2, 2, 2, 9, 2
(Multiple Choice)
4.9/5 (36)
Assume the distribution is normal. Use the area of the normal curve to answer the question. Round to the nearest whole percent:
-The average size of the bass in a lake is 11.4 inches, with a standard deviation of 3.2 inches. Find the probability of catching a bass longer than 17 inches.
(Multiple Choice)
4.7/5 (36)
Filters
- Essay(0)
- Multiple Choice(0)
- Short Answer(0)
- True False(0)
- Matching(0)