Exam 10: Data Description and Probability Distributions
Exam 1: Linear Equations and Graphs59 Questions
Exam 2: Functions and Graphs178 Questions
Exam 3: Mathematics of Finance57 Questions
Exam 4: Systems of Linear Equations; Matrices115 Questions
Exam 5: Linear Inequalities and Linear Programming26 Questions
Exam 6: Linear Programming: The Simplex Method58 Questions
Exam 7: Logic, Sets, and Counting51 Questions
Exam 8: Probability59 Questions
Exam 9: Markov Chains60 Questions
Exam 10: Data Description and Probability Distributions65 Questions
Exam 11: Games and Decisions52 Questions
Exam 12: Appendix A: Basic Algebra Review45 Questions
Exam 13: Appendix B: Special Topics20 Questions
Select questions type
Following is a sample of the percent increases in the price of a house from 2000 to 2005 in 8 regions of the U. S.
75 130 145 150 150 225 225 300
Find the median.
(Multiple Choice)
4.8/5  (32)
(32)
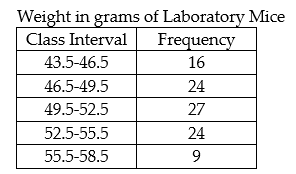
The frequency distribution below gives the weight in grams of 100 laboratory mice. What is the probability that the weight of a healthy mouse selected randomly from the sample will be more than 52 grams?
(Multiple Choice)
4.8/5 (38)
If a baseball player has a batting average of 0.420, what is the probability that the player will get at least 2 hits in the next four times at bat?
(Multiple Choice)
4.8/5 (34)
Given a normal distribution with mean 120 and standard deviation 5, find the number of standard deviations the measurement is from the mean. Express the answer as a positive number.
-114.2
(Multiple Choice)
4.7/5 (25)
Here are the commutes (in miles) for a group of six students. Find the standard deviation.
14.7 16.3 34.0 33.7 22.6 16.0
Round to two decimal places.
(Multiple Choice)
4.9/5 (41)
Construct a bar graph of the given frequency distribution:
-The frequency distribution indicates the number of fish caught by each fisherman in a group of 250 fishermen. 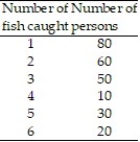

(Multiple Choice)
4.8/5 (32)
Evaluate  for the given values of n, x, and p.
-n = 30, x = 12, p = 0.20
for the given values of n, x, and p.
-n = 30, x = 12, p = 0.20
(Multiple Choice)
4.8/5 (37)
The life expectancy (in hours) of a fluorescent tube is normally distributed with mean 7,000 and standard deviation 1,000. Find the probability that a tube lasts for more than 8,900 hours.
(Multiple Choice)
4.7/5 (40)
Construct a broken-line graph of the data in the table:
-The following table gives the total amount of precipitation during the given months. Use time on the horizontal scale for your line graph. 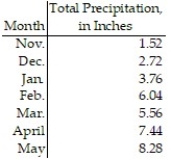
(Short Answer)
4.8/5 (36)
Given a normal distribution with mean 120 and standard deviation 5, find the number of standard deviations the measurement is from the mean. Express the answer as a positive number.
-125
(Multiple Choice)
4.8/5 (31)
Evaluate for the given values of n, x, and p.
-n = 6, x = 3, p = 
(Multiple Choice)
4.7/5 (38)
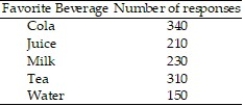
Construct a pie graph, with sectors given in percent, to represent the data in the given table:
-
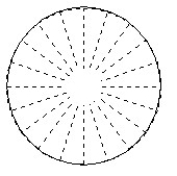
(Multiple Choice)
4.9/5 (36)
Construct a pie graph, with sectors given in percent, to represent the data in the given table:
-

(Multiple Choice)
4.8/5 (38)
Find the mode for the data set:
3, 13, 30, 3, 8, 30, 13, 8, 6, 3, 3, 3, 3, 8, 3
(Multiple Choice)
4.8/5 (41)
In a certain college, 33% of the math majors belong to foreign student. If 10 students are selected at random from the math majors, that is the probability that no more than 6 are foreign?
(Multiple Choice)
4.7/5 (31)
Construct a pie graph, with sectors given in percent, to represent the data in the given table:
-

(Multiple Choice)
4.8/5 (40)
Given the frequency distribution below, what is the probability of the hourly wage of a person chosen at random from the sample being less than $4.495?
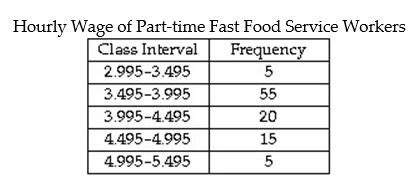
(Multiple Choice)
4.7/5 (32)
Assume the distribution is normal. Use the area of the normal curve to answer the question. Round to the nearest whole percent:
-The mean clotting time of blood is 7.35 seconds, with a standard deviation of 0.35 seconds. What is the probability that blood clotting time will be less than 7 seconds?
(Multiple Choice)
4.9/5 (43)
Filters
- Essay(0)
- Multiple Choice(0)
- Short Answer(0)
- True False(0)
- Matching(0)